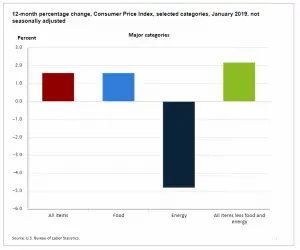
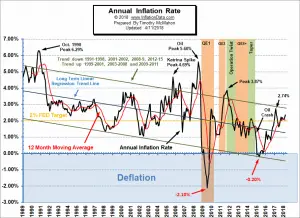
The U.S. Bureau of Labor Statistics (BLS) released their monthly Consumer Price Index report on February 13th 2019, for the 12 months through January 2019. Annual Inflation is Down Annual inflation in January was 1.55% down from 1.91% in December and 2.18% in November. January's CPI was 251.712 up from December's CPI of 251.233, November was 252.038 Note: January's CPI was only slightly above the 251.588 back in May. Monthly Inflation for January was 0.19%, December was -0.32% virtually identical to November's -0.33%. Next release March 12th We've added another bar to the Annual Inflation Rate Chart indicating Quantitative Tightening (QT) check it out … [Read more...]
Are Deflationary Forces Taking Hold Again?
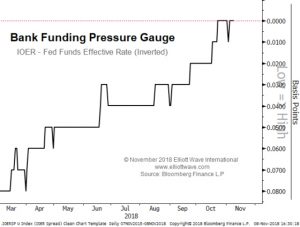
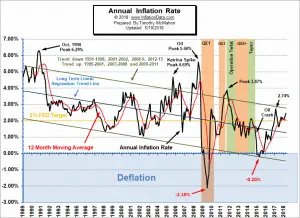
From the chart below we can see that deflation was an issue in 2009 as the market eliminated billions of dollars in assets when it crashed. The FED used all the tricks in the book to combat the contraction of the money supply including lowering interest rates to near zero and when that wasn't enough it began buying assets through its "quantitative easing" (QE) programs. But the deflationary forces weren't through yet and by 2015 the FED was once again battling deflation. In the chart below we can see that after dropping interest rates to almost zero they kept them there until 2016 when they increased rates very tentatively. But in 2017 they began raising rates a bit more … [Read more...]
2018 Ends with More Disinflation
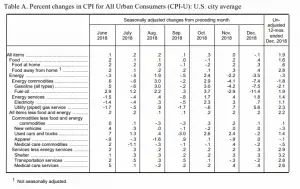
The U.S. Bureau of Labor Statistics (BLS) released their monthly Consumer Price Index report on January 11th 2019, for January 1 through December 31, 2018. Annual Inflation is Down Annual inflation in December was 1.91% down from November's 2.18%. December's CPI was 251.233 which was below November's 252.038, below October, September and even below the 251.588 in May. Monthly Inflation for December was -0.32% virtually identical to November's -0.33%. Next release February 13th Monthly Inflation: According to the BLS commissioner's report, "In December, the Consumer Price Index for All Urban Consumers fell 0.1 percent on a seasonally adjusted basis; rising 1.9 percent over … [Read more...]
November was Deflationary
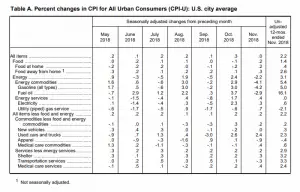
The U.S. Bureau of Labor Statistics (BLS) released their monthly Consumer Price Index report on December 12th 2018, for the 12 month period through the end of November. Annual Inflation is Down Annual inflation in November was 2.18% down from October's 2.52% and below September's 2.28% and the 2.70% in August. CPI was 252.038 in November below October, September and the 252.146 in August. Monthly Inflation for November was -0.33 October was 0.18% in September it was 0.12%, compared to virtually zero in November 2017. Next release January 11th Monthly Inflation: According the the BLS Commissioner's report: "In November, the Consumer Price Index for All Urban Consumers was … [Read more...]
October Inflation Up Slightly
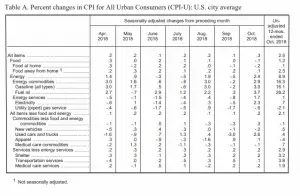
The U.S. Bureau of Labor Statistics (BLS) released their monthly Consumer Price Index report on November 14th 2018, for the 12 month period through the end of October. Annual Inflation is Up Annual inflation was 2.52% in October up from 2.28% in September. CPI was 252.885 in October up from 252.439 in September, and 252.146 in August. Monthly Inflation for October was 0.18%, 0.12% in September, compared to -0.06% in October 2017. Next release December 12th Monthly Inflation: According the the BLS Commissioner's report: "The Consumer Price Index for All Urban Consumers (CPI-U) increased 0.3 percent in October on a seasonally adjusted basis after rising 0.1 percent in … [Read more...]
Did the Democrats Really Vote Against the Social Security Cost of Living Increase?
There is a meme circulating around Facebook right now about Democrats voting against the 2.8% Cost of living increase. Normally, here at inflationData we try to avoid politics unless it directly relates to inflation, or our other major topics covered. But in this case I feel compelled to address this issue. The quick answer is that this is "NOT TRUE". However, if the MEME was phrased slightly differently it would be "TECHNICALLY TRUE". If the Meme said, "NONE of the Democrats voted FOR the Social Security Cost of Living Increase" it would be "TECHNICALLY TRUE". Likewise, if it said "NONE of the Republicans voted FOR the Social Security Cost of Living Increase" it would also … [Read more...]
August Inflation Down
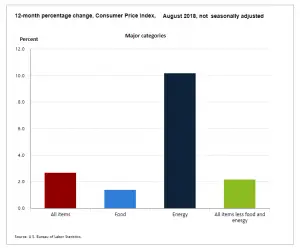
On September 13th 2018, the U.S. Bureau of Labor Statistics released their monthly Consumer Price Index report on the status of Inflation for the 12 months through the end of August. Annual Inflation is Down Annual inflation in August was 2.70% down from 2.95% in July and 2.87% in June. (BLS rounds both to 2.9%) CPI was 252.146 in August, 252.006 in July and 251.989 in June. Monthly Inflation for August was 0.06%, July was 0.01%, and June was 0.16% compared to 0.30% in August 2017. Next release October 11th Monthly Inflation: Annual inflation for the 12 months ending in August was 2.70%. 2.95% up from 2.87% in June. The U.S. Bureau of Labor Statistics (BLS) rounds … [Read more...]
Annual Inflation Up Slightly in June
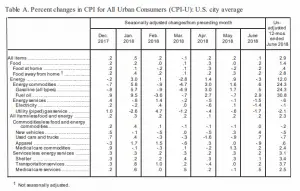
The U.S. Bureau of Labor Statistics released the Annual Inflation Rate data for the year through the end of June on July 12th 2018. Annual Inflation is Up Annual inflation rate was 2.87% in June up from 2.80% in May, 2.46% in April, 2.36% in March and 2.21% in February. CPI-U was 251.989 in June, 251.588 in May, 247.867 in January and 246.524 in December. Monthly Inflation for June was 0.16% while May was 0.42%, April was 0.40%, up from 0.23% in March 2018. June 2017 was only 0.09% Next release August 10th Monthly Inflation: Annual inflation for the 12 months ending in June was 2.87% up slightly from May's 2.80% but up sharply from April's 2.46%. Current levels are … [Read more...]
April Inflation UP
The U.S. Bureau of Labor Statistics released the Annual Inflation Rate data for the year through the end of April on May 10th 2018. Annual Inflation is Up Annual inflation rate was 2.46% up from 2.36% in March and 2.21% in February. CPI was 250.546 in April, 249.554 in March, 248.991 in February, 247.867 in January and 246.524 in December. Monthly Inflation for April was 0.40%, up from 0.23% in March 2018 Next release June 12th Monthly Inflation: Annual inflation for the 12 months ending in April was 2.46% up from 2.36% in March. February was 2.21% and January was 2.07%. Early in 2017 inflation was 2.50% in January, 2.74% in February and 2.38% in … [Read more...]
March Inflation Data Released
The U.S. Bureau of Labor Statistics released the Annual Inflation Rate data for the year through the end of March on April 11th 2018. Annual Inflation is Up Annual inflation rate was 2.36% up from 2.21% in February. CPI was 249.554 in March, 248.991 in February, 247.867 in January and 246.524 in December. Monthly Inflation for March 2018= 0.23% Monthly Inflation for March 2017= 0.08% Next release May 10th Monthly Inflation: Typically the monthly inflation rate is highest during the first quarter (January through March) and lowest during the last quarter (October through December). March 2018 had 0.23% monthly inflation which was below February's 0.45% but it … [Read more...]

