
On September 13th 2018, the U.S. Bureau of Labor Statistics released their monthly Consumer Price Index report on the status of Inflation for the 12 months through the end of August.
Annual Inflation is Down
- Annual inflation in August was 2.70% down from 2.95% in July and 2.87% in June. (BLS rounds both to 2.9%)
- CPI was 252.146 in August, 252.006 in July and 251.989 in June.
- Monthly Inflation for August was 0.06%, July was 0.01%, and June was 0.16% compared to 0.30% in August 2017.
- Next release October 11th
Monthly Inflation:
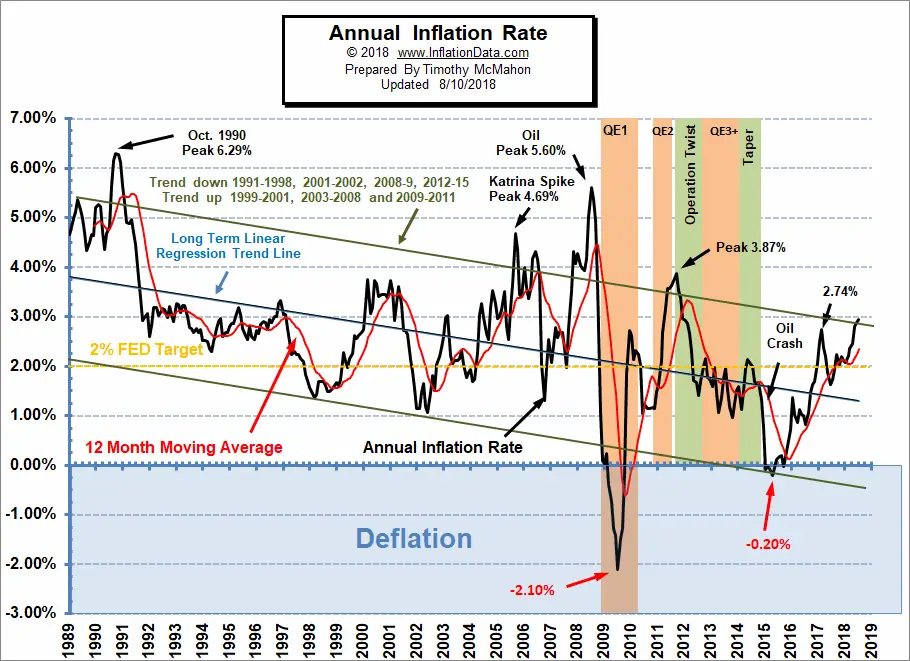
Annual inflation for the 12 months ending in August was 2.70%. 2.95% up from 2.87% in June. The U.S. Bureau of Labor Statistics (BLS) rounds both to 2.9% and accordingly reports the inflation rate as “unchanged”.
According to the BLS commissioner’s report, “In August, the Consumer Price Index for All Urban Consumers increased 0.2 percent seasonally adjusted; rising 2.7 percent over the last 12 months, not seasonally adjusted. The index for all items less food and energy rose 0.1 percent in August (SA); up 2.2 percent over the year (NSA)…
Increases in the indexes for shelter and energy were the main contributors to the seasonally adjusted monthly increase in the all items index. The energy index increased 1.9 percent in August; a 3.0-percent increase in the gasoline index was the largest factor, but the other energy component indexes also rose. The shelter index increased 0.3 percent in August, the same increase as in July. The food index rose only slightly in August, with the index for food at home unchanged.”
Note: SA= Seasonally Adjusted, NSA= Not Seasonally Adjusted
The following table shows the changes from August for the major categories in seasonally adjusted terms and for the entire 12 months in unadjusted terms.
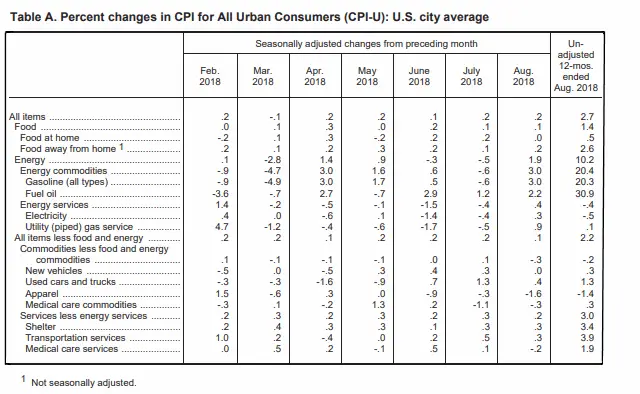
From the table we can see that on a monthly Seasonally adjusted basis Used Cars and Trucks actually fell -1.6% while Gasoline rose 3.0% but that doesn’t mean that they fully cancel each other out since they are weighted based on the percentage of an average budget that each one consumes. On an annual unadjusted basis however we see that Used Cars and Trucks are up 1.3% and Gasoline is up 20.3%. Overall, energy is up 10.2% over the year and shelter is up 3.4%.
Typically the monthly inflation rate is highest during the first quarter (January through March) with April and May often being among the high months but not always.
The lowest monthly inflation is typically during the last quarter (October through December) with June through September typically being moderate.
Although the monthly differences seem relatively small, if we had 12 months of 0.42% inflation we would have 5.04% annual inflation but 12 months at 0.06% like we had in August would only result in 0.72% annual inflation. But when higher months are combined with lower inflation months and even some negative months the annual inflation becomes much lower. We can expect that the last quarter of this year will bring the inflation rate down further. Currently our Moore Inflation Predictor is projecting that the annual inflation rate will fall over the next couple of months toward year’s end.
Regional Inflation Information
The U.S. Bureau of Labor Statistics also produces regional data. So if you are interested in more localized inflation information you can find it here.
Food and Energy Breakdown
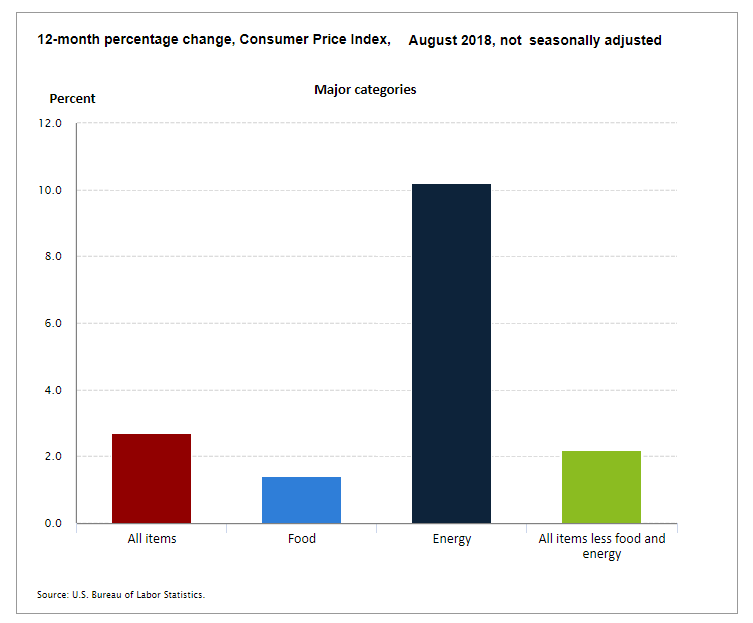
The BLS publishes an index entitled “All items Less Food and Energy” which often causes people some confusion. It doesn’t mean they stopped including food and energy in the Consumer Price Index. It just means that they have broken them out so you can compare their increase to other components. In this chart we can see the effects of food, energy and all other items on the total index. For more info see What is Core Inflation?
In the chart below it looks like energy prices should bring “All items” up more than it does. But according to the BLS energy is only 7.513% of the average household’s total budget. Food is 13.384%, Housing is 41.772%, Transportation is 16.537% etc. But you can’t simply add these percentages up either because actually energy is part of the cost of housing and also part of the cost of transportation so if you added them up you would be counting energy twice. To see the full breakdown of all the percentages go here.
Misery Index
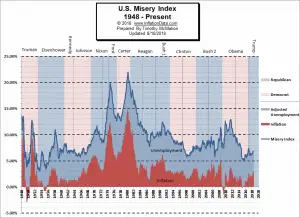
The misery index as of September 2018 (based on the most recent official government inflation and unemployment data for the 12 months ending in August) is at 6.60% down from 6.85% in July, and 6.87% in June.
At 6.60%, the misery index has returned to the May level but it is still above the 6.36% of April. However, the combination making up the 6.6% is slightly different. At 3.90% unemployment is above the 3.8% in May but inflation is down from 2.8% to 2.7%. This makes the misery index the same as April 2017 as well but then it was 4.4% unemployment and 2.2% inflation. But it is still less than half of the peak of 12.87% in both October and November 2011 which was pretty miserable. The Misery index is still well below the February 2017 peak of 7.44%. The average inflation rate since the beginning of the Misery Index in January 1948 is 3.53% which is still higher than current inflation levels… so if inflation were “average” the misery index would be higher.
[Read More…]
Moore Inflation Predictor
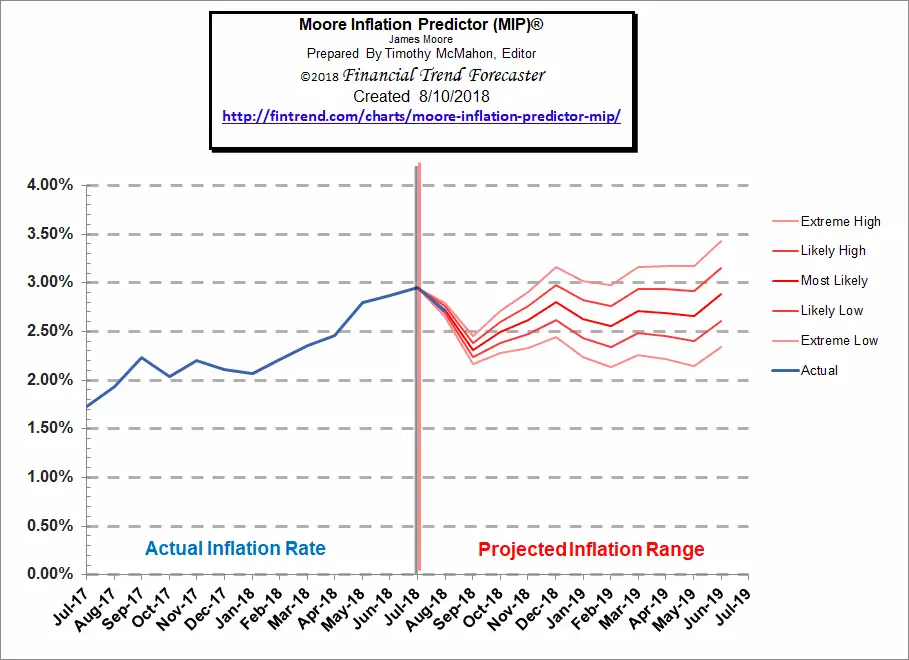
As you can see from the chart above, last month our MIP Chart was projecting a good size decrease and the actual line was right on target of our projection.
See Moore Inflation Forecast for this month’s projection.
NYSE Rate of Change (ROC)©
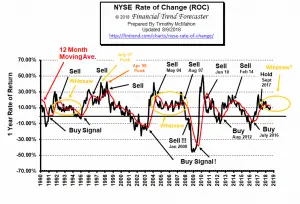
The NYSE index entered the “Whipsaw period” in September 2017 being above its moving average in November, below in December, above in January, below in February, back up to the moving average in March below once again in April and falling further in May and June. In July it moved even further below its moving average looking very weak. In August we saw a rebound bringing it much closer to its moving average, hinting at a crossing back above but in September it has fallen further below. If we don’t get a break above soon we will have to reevaluate and list it as a sell signal rather than a hold.
See the NYSE ROC for more info.
NASDAQ Rate of Change (ROC)©
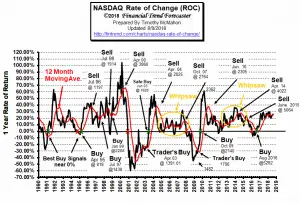 The NASDAQ continues to outperform the NYSE. NASDAQ ROC is very slightly below its moving average, but is probably in a “whipsaw” period making us cautious… thus the “hold” signal.
See NASDAQ ROC for more.
You Might Also Like:
From InflationData.com
- Can Crypto Solve Venezuela’s Hyperinflation Problem?
- Cost of Living: LA and New York vs. The World
- What Impact (if any) Does Disruption have on Inflation?
- Debt and Inflationary Pressures: A Lesson in Economic Interactivity
- Inflation Risk
- How Does Inflation Affect the Price of Gold?
- The Effects of Inflation and Interest Rates on Commodity Prices
Read more on UnemploymentData.com.
- Full Employment is Near – Differential between U3 and U6 reaches September 2006 Lows
- Start Your New Career Right
- 4 Effective Ways to Promote Your Business
- Careers for Animal Lovers
- How to Infuse Your Business with Staying Power
- EU Unemployment Nearing Pre-Recession Levels
- Dress to Impress: 4 Tips to Leaving a Good Impression in a Job Interview
- Landing a Good Job Teaching ESL
- How to Know It’s Time to Start Your Own Business
- 4 Tips for Young Professionals Just Starting out
From Financial Trend Forecaster
- Technological Solution to 100 Year Old Oil Problem
- Oil Price War: Saudi Arabia vs. Iran
- Coke, Meth And Booze: The Dark Side Of The Permian Oil Boom
- Why Graphene Hasn’t Taken Over the World- Yet
- New Oil Cartel Threatening OPEC
- 3 Breakthrough Technologies Changing The Energy Sector
- Can Saudi Arabia Prevent The Next Oil Shock?
- IEA: High Oil Prices “Taking A Toll” On Demand
- A New Lithium War Is About To Begin
- When Will Electric Cars Take Over The Roads?
- This Doesn’t Happen in Bear Markets
- Is Gold on the Verge of a Bottom?
- Moving Averages Help You Define Trend – Here’s How
- Charts Say Stocks Could Rise For 10-15 Years
- Latest Economic Data Doesn’t Align with Yield Curve Fears
- The Stock Market Big Picture
- Using Longer Timeframes To Combat Volatility Fatigue
- Recent Breakouts Say a Lot about Markets and Economy
- Are Wars Bullish or Bearish for Stocks?
- Tariffs May Not Slow Profit Momentum
From OptioMoney.com
- 5 Ways to Reduce Your Business Credit Risk
- How Does a Surety Bond Differ from Insurance?
- When is the Right Time to Buy Life Insurance?
- 4 Things Home Buyers Shouldn’t Do During the Mortgage Process
- Tips for Avoiding Cash Crunches and Managing Cash Flow in Business
- How to Survive Bankruptcy
- How to Lower the Chances of Bankruptcy as a Personal Business Owner
- How to Handle Medical Bill Debt
- The Costs of Moving: 4 Thrifty Tips to Keep Your Next Move Cheap
- How Smart Entrepreneurs Manage and Insure Their Assets
From Your Family Finances
- Is an FHA Loan Right for You?
- Budgeting for Upcoming Purchases and Goals
- Financial Hard Times: How to Pull Your Family out of Debt
- Are Your Water Bills “Eating You Alive”?
- 3 Ways Keeping Tabs on Your Credit Helps More Than Just Your Finances
- A Guide to: Making the Most of Cash Back Rewards Credit Cards
- How to Start and Build a Valuable Coin Collection
- Consistency Should Be Your Financial Foundation
- Newly Weds: 5 Reasons You Need a Financial Planner in the Early Years
- 4 Financial Planning Tips for Parents
- How to Save Money on Utilities Comfortably
- Home Office Ideas: Turn a Spare Room into Your Dream Workspace
- Diversification: The Simple Secret to Building Your Wealth

Leave a Reply