
Inflation During the “Great Depression” 1930’s
The great depression officially began with the stock market crash on September 4, 1929. But for over 50% of the U.S. population who lived on farms the Depression began ten years earlier with the dramatic fall of commodity prices when demand from Europe dried up at the end of WWI. Much of the “Roaring” part of the Twenties was the result of loose credit and stock market speculation. This speculation is thought to have sown the seeds of the great depression.
The stock market crash caused a panic and thus a liquidity crisis as banks and other lenders became risk adverse and refused to loan money. The stock market actually began rebounding in early 1930, and returned to early 1929 levels by April. But because of the parabolic rise in stock prices in 1929, this was still almost 30% below the peak of September 1929.
Many economists believe that government tight money policies made the Depression worse and that the Federal Reserve did exactly the wrong things. According to the Keynesians, although President Roosevelt tried public works, farm subsidies, and other devices to restart the US economy, he never spent enough to bring the economy out of recession until the start of World War II.
Monetarists, including Milton Friedman, argue that the Great Depression was mainly caused by monetary contraction, they believe that the Federal Reserve allowed the money supply as measured by the M2 money supply to shrink by one-third from 1929–1933, thereby transforming a normal recession into the Great Depression.
The Austrian School of Economics also blames the FED but rather than not doing enough they believe that the key cause of the Depression was the FED’s expansion of the money supply in the 1920s that led to an unsustainable credit-driven boom. In February 1929 Austrian economist Friedrich Hayek published a paper predicting the Federal Reserve’s actions would lead to a crisis starting in the stock and credit markets. According to Murray Rothbard, who wrote America’s Great Depression, government intervention delayed the market’s adjustment and made the road to complete recovery more difficult.
Marxists blamed the rich, believing that recessions and depressions are the result of having no restrictions on the accumulation of capital and when too much capital is in too few hands recessions result. Hoover and Roosevelt attempted to remedy this problem with large government work projects. Sowing seeds of Socialism in the American economy in the New Deal and public works projects.
Inflation and Deflation During the Great Depression of the 1930’s
By looking at the flow of red ink in this table we can see that the majority of the deflation occurred from 1930-1932 but it resumed again in 1938-39. These are not monthly rates but annual inflation rates. Therefore any negative cell represents net falling prices for the previous 12 months.
| Year | Jan- | Feb- | Mar- | Apr- | May- | Jun- | Jul- | Aug- | Sep- | Oct- | Nov- | Dec- |
| 1930 | 0.00% | -0.58% | -0.59% | 0.59% | -0.59% | -1.75% | -4.05% | -4.62% | -4.05% | -4.62% | -5.20% | -6.40% |
| 1931 | -7.02% | -7.65% | -7.69% | -8.82% | -9.47% | -10.12% | -9.04% | -8.48% | -9.64% | -9.70% | -10.37% | -9.32% |
| 1932 | -10.06% | -10.19% | -10.26% | -10.32% | -10.46% | -9.93% | -9.93% | -10.60% | -10.67% | -10.74% | -10.20% | -10.27% |
| 1933 | -9.79% | -9.93% | -10.00% | -9.35% | -8.03% | -6.62% | -3.68% | -2.22% | -1.49% | -0.75% | 0.00% | 0.76% |
| 1934 | 2.33% | 4.72% | 5.56% | 5.56% | 5.56% | 5.51% | 2.29% | 1.52% | 3.03% | 2.27% | 2.27% | 1.52% |
| 1935 | 3.03% | 3.01% | 3.01% | 3.76% | 3.76% | 2.24% | 2.24% | 2.24% | 0.74% | 1.48% | 2.22% | 2.99% |
| 1936 | 1.47% | 0.73% | 0.00% | -0.72% | -0.72% | 0.73% | 1.46% | 2.19% | 2.19% | 2.19% | 1.45% | 1.45% |
| 1937 | 2.17% | 2.17% | 3.65% | 4.38% | 5.11% | 4.35% | 4.32% | 3.57% | 4.29% | 4.29% | 3.57% | 2.86% |
| 1938 | 0.71% | 0.00% | -0.70% | -0.70% | -2.08% | -2.08% | -2.76% | -2.76% | -3.42% | -4.11% | -3.45% | -2.78% |
| 1939 | -1.41% | -1.42% | -1.42% | -2.82% | -2.13% | -2.13% | -2.13% | -2.13% | 0.00% | 0.00% | 0.00% | 0.00% |
Monthly Inflation
On a monthly basis we can see prices dropping by ½% or more each month in 1930 and often by 1% or more in 1931 and by over 2% in January of 1932.
| 1930 | -0.58% | -0.58% | -0.59% | 0.59% | -0.59% | -0.59% | -1.19% | -0.60% | 0.61% | -0.60% | -0.61% | -1.83% |
| 1931 | -1.24% | -1.26% | -0.64% | -0.64% | -1.29% | -1.31% | 0.00% | 0.00% | -0.66% | -0.67% | -1.34% | -0.68% |
| 1932 | -2.05% | -1.40% | -0.71% | -0.71% | -1.44% | -0.73% | 0.00% | -0.74% | -0.74% | -0.75% | -0.75% | -0.76% |
| 1933 | -1.53% | -1.55% | -0.79% | 0.00% | 0.00% | 0.79% | 3.15% | 0.76% | 0.00% | 0.00% | 0.00% | 0.00% |
| 1934 | 0.00% | 0.76% | 0.00% | 0.00% | 0.00% | 0.75% | 0.00% | 0.00% | 1.49% | -0.74% | 0.00% | -0.74% |
| 1935 | 1.49% | 0.74% | 0.00% | 0.73% | 0.00% | -0.72% | 0.00% | 0.00% | 0.00% | 0.00% | 0.73% | 0.00% |
| 1936 | 0.00% | 0.00% | -0.72% | 0.00% | 0.00% | 0.73% | 0.72% | 0.72% | 0.00% | 0.00% | 0.00% | 0.00% |
| 1937 | 0.71% | 0.00% | 0.71% | 0.70% | 0.70% | 0.00% | 0.69% | 0.00% | 0.69% | 0.00% | -0.68% | -0.69% |
| 1938 | -1.39% | -0.70% | 0.00% | 0.71% | -0.70% | 0.00% | 0.00% | 0.00% | 0.00% | -0.71% | 0.00% | 0.00% |
| 1939 | 0.00% | -0.71% | 0.00% | -0.72% | 0.00% | 0.00% | 0.00% | 0.00% | 2.17% | -0.71% | 0.00% | 0.00% |
The Consumer Price Index CPI from 1930 – 1939
The following table shows the Consumer Price index for the ten years from 1930 through 1939 based upon a 1982-84 base of 100. This table provides the basis for calculating the inflation rates and we can see that in January 1930 the CPI index was 17.1 and in December nine years later it was at 14.0 resulting in a net deflation for the entire decade.
| Year | Jan- | Feb- | Mar- | Apr- | May- | Jun- | Jul- | Aug- | Sep- | Oct- | Nov- | Dec- |
| 1930 | 17.1 | 17.0 | 16.9 | 17.0 | 16.9 | 16.8 | 16.6 | 16.5 | 16.6 | 16.5 | 16.4 | 16.1 |
| 1931 | 15.9 | 15.7 | 15.6 | 15.5 | 15.3 | 15.1 | 15.1 | 15.1 | 15.0 | 14.9 | 14.7 | 14.6 |
| 1932 | 14.3 | 14.1 | 14.0 | 13.9 | 13.7 | 13.6 | 13.6 | 13.5 | 13.4 | 13.3 | 13.2 | 13.1 |
| 1933 | 12.9 | 12.7 | 12.6 | 12.6 | 12.6 | 12.7 | 13.1 | 13.2 | 13.2 | 13.2 | 13.2 | 13.2 |
| 1934 | 13.2 | 13.3 | 13.3 | 13.3 | 13.3 | 13.4 | 13.4 | 13.4 | 13.6 | 13.5 | 13.5 | 13.4 |
| 1935 | 13.6 | 13.7 | 13.7 | 13.8 | 13.8 | 13.7 | 13.7 | 13.7 | 13.7 | 13.7 | 13.8 | 13.8 |
| 1936 | 13.8 | 13.8 | 13.7 | 13.7 | 13.7 | 13.8 | 13.9 | 14.0 | 14.0 | 14.0 | 14.0 | 14.0 |
| 1937 | 14.1 | 14.1 | 14.2 | 14.3 | 14.4 | 14.4 | 14.5 | 14.5 | 14.6 | 14.6 | 14.5 | 14.4 |
| 1938 | 14.2 | 14.1 | 14.1 | 14.2 | 14.1 | 14.1 | 14.1 | 14.1 | 14.1 | 14.0 | 14.0 | 14.0 |
| 1939 | 14.0 | 13.9 | 13.9 | 13.8 | 13.8 | 13.8 | 13.8 | 13.8 | 14.1 | 14.0 | 14.0 | 14.0 |
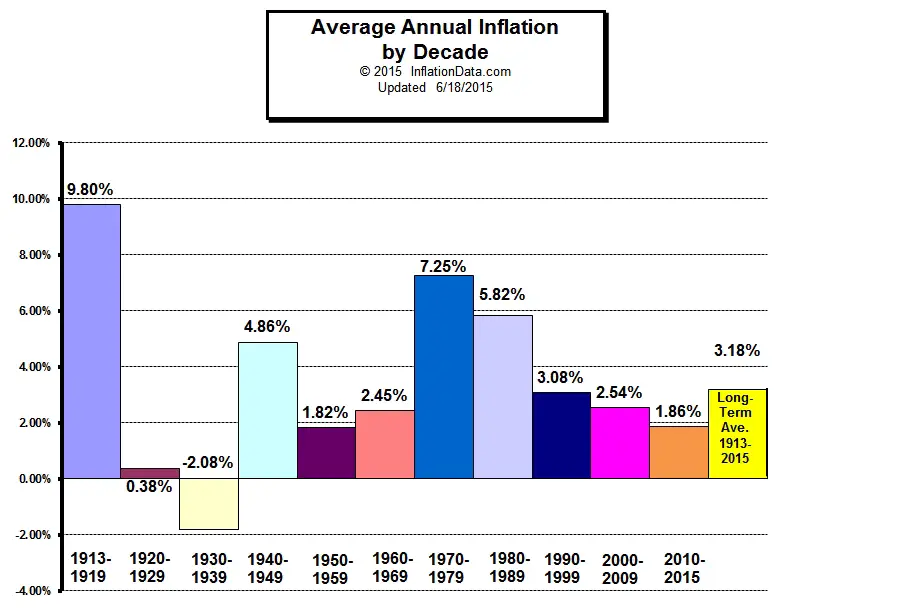
Chart Comparing the 1930’s to other Decades
In this chart we can see how the 1930’s compare to other decades.
Click Chart for more Information
Inflation Chart 1930- 1939
The following chart shows the inflation rates during the period from 1930-1939.
 Click Chart for Larger Image
See Also:
 |
 |
 |
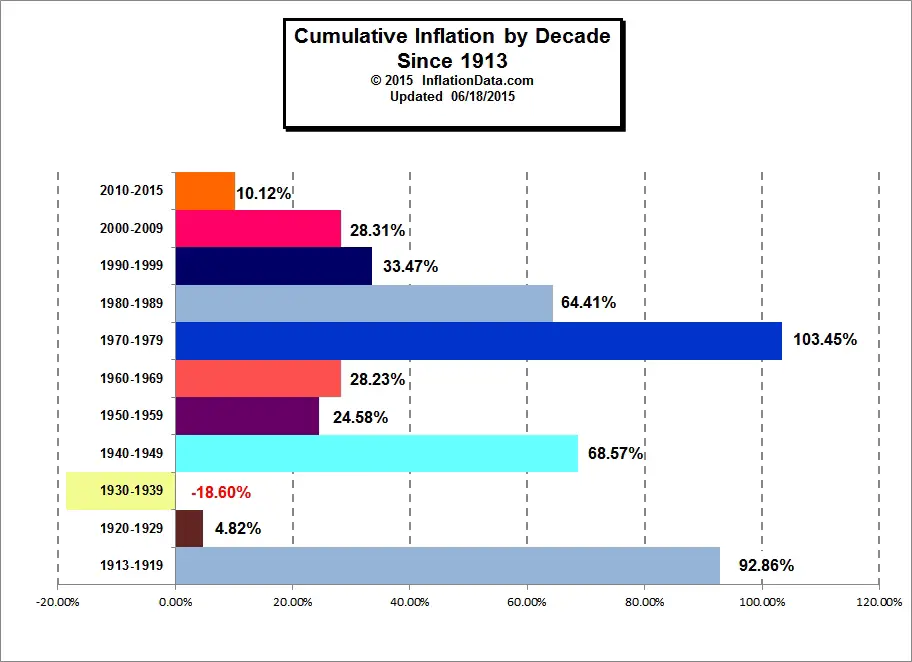
| Average Annual Inflation by Decade | Total Inflation by Decade | Total Cumulative Inflation |
- Inflation and Consumer Price Index- Decade Commentary
- WWI – The beginning of the of the CPI the Inflationary period 1913 – 1919
- The “Roaring Twenties” Inflation and Deflation 1920-1929
- The Great Depression and the Deflationary 1930′s– 1930-1939 — This Page
- World War II — the volatile 1940′s– High and Low Inflation 1940-1949
- The 1950′s “Happy Days”– Inflation and CPI 1950-1959
- The 1960′s the age of possibility– Low Inflation 1960-1969
- The Inflationary 1970’s Inflation and CPI 1970-1979
- The Reagan Era Lower Inflation 1980-1989
- The Decade of Free Enterprise Inflation 1990-1999

Tim
Great site. I believe that inflation, if measuring the costvof living, is vastly understated. For one, the formula is flawed. More
importantly, the worst thing that can happen to massively indebted western govts is to show any inflation exists. For then, interest rates rise and game over for stocks and government borrowings to keep their societies stable with social ans corp welfare.
What say you?
Thx
Rob Branson
Rob,
Governments certainly have an incentive to understate the rate of inflation since the COLA is baked into a lot of different things like Social Security, etc. However, I’m not sure it is vastly understated. A lot depends on your personal circumstances and where you live. The cost of living is vastly different between NY city and rural Arkansas not to mention Alaska or Hawaii.
In addition, your spending depends on your stage of life, for instance the elderly spend much more on Healthcare and less on housing than younger people do. On the other hand, things like Computers and other Electronic items have been falling in price for decades but the elderly don’t buy them as much as young people do.
So it is virtually impossible to get an index that covers everyone accurately. The BLS has developed a CPI-E that is supposed to be more accurate for the elderly but haven’t implemented it for Social Security adjustments… perhaps because it would mean larger increases in SS payments since Healthcare is more heavily weighted in the CPI-e.
In 1950’s Southern California, it cost $5 to stay one night in a hospital. Minimum wage was $1.00.
Today, it costs about $2000 to stay one night in a hospital. Minimum wage is $14.
In my opinion, the consolidation of inflation to certain areas of the economy are the cause of most major imbalances.
It’s like growing 200lb head on a withered 100lb body. The people suffer so a few can live in excessive luxury.
What’s the point of doing something, if the future falls apart?
I love your example. Wages have not increased the same rate as most expenses today. However, here’s where using examples like hospital stays get sticky: is healthcare over priced, or are wages underpriced?
I found a sheet of what it cost to buy groceries, a house, a car, a college education etc. in the 1950s compared to now. The biggest hike was a college education. (I think I calculated that it increased 2,000%.) The smallest? Groceries. So why do we have food stamps? How are grocery stores making any money? What about the farmers?
You really do have to take everything into consideration when looking at these matters, otherwise you get a very small piece of the puzzle that can misconstrue the data.
I wish there was a clear-cut solution to these price disparities, but the fact of the matter is that it just simply isn’t the 1950s anymore. That’s why issues like heath care and affordable housing are such a difficult feat to tackle… Medicine has come a long way since the 1950s, and women contribute to dual-income households. These components help, yet contribute to the issues we face today.
Education increases were high primarily due to the Government subsidizing student loans which made students less price sensitive. While food increases were much lower because of all the automation (i.e. productivity increases) in the farming sector. So price increases are NOT monolithic, every price has its own forces moving them higher or lower.