• Home
  • Related Sites
    • Financial Trend Forecaster
      • Moore Inflation Predictor
      • NYSE Rate of Change (ROC)
      • NASDAQ Rate of Change (ROC)
      • Crypto ROC- BTC & ETH
    • Unemployment Data
      • Historical Employment Data
      • Unemployment Rate Chart
      • Labor Force Participation Rate
    • Optio Money
    • Elliott Wave University
    • More Resources
  • Definitions
    • What is Inflation?
    • What is Core Inflation?
    • Inflation vs CPI
    • What is Deflation?
    • What is Disinflation?
    • What is Agflation?
    • What is Stagflation?
    • What is Hyperinflation?
    • What is Quantitative Easing?
    • What is Quantitative Tightening?
    • What is Velocity of Money?
    • What is Fiat Currency?
    • How Do I Calculate Inflation?
    • What are “Sticky Prices” and Why Do They Matter?
  • Featured Content
  • About Us
  • Feedback
    • Sitemap
  • Subscribe Now

InflationData.com

Your Place in Cyber Space for Inflation Data

CPIWidget-Feb26
  • Numerical Inflation Data
    • Current Inflation Rate
    • Monthly Inflation Rate (Moved)
    • Historical U.S. Inflation Rates
    • Historical CPI
  • Inflation Charts
    • Ann. Inf. Rate Chart
    • Long Term Inflation >
      • Ave. Inf. by Decade
      • Total Inf. by Decade
      • Inflation 1913-1919
      • Inflation 1920-1929
      • Inflation 1930-1939
      • Inflation 1940-1949
      • Inflation 1950-1959
      • Inflation 1960-1969
      • Inflation 1970-1979
    • Cumulative Inflation
    • FED Monetary Policy and Inflation
    • Inflation and Recession
    • Confederate Inflation (1861 – 1865)
    • Misery Index
    • The 3 Stages of Inflation
    • 15-Yr Inflation Trends Chart
  • Inflation Calculators
    • Cumulative Inf. Calc.
    • How Much Would it Cost
    • Salary Inf. Calc.
    • Cost of Living Calc.
    • U.K. Inf. Calc.
    • Cost of Gas Calc.
    • Net Worth Calc.
    • Lifetime Earnings Calc.
    • Savings Goal Calc.
    • Financial Calculators
  • Inf. Adjusted Prices
    • Energy >
      • Inflation Adj. Gas Prices
      • Historical Oil Prices Chart
      • Crude Oil Price (Table)
      • Natural Gas Prices
      • Electricity Prices
      • Oil vs Gold
    • Gold >
      • Inflation Adjusted Annual Average Gold Prices
      • Gold is a “Crisis Hedge” not an  “Inflation Hedge”
      • Comparing Oil vs. Gold
    • Corn Prices
    • Education Inflation
    • Housing Prices
    • Mortgage Rates
    • NYSE Index
    • Inf. Indexed Bonds
    • Movie Revenues
    • Inflation-Adjusted Wages
  • Cost of Living
    • Calculate Cost of Living
    • Cost-of-living Adj. (COLA)
    • Consumer Price Index CPI
      • Historical CPI
      • Current CPI
      • CPI Release Dates
    • Gas Prices >
      • Cost of Gas
      • Cost of Gas Per Month
      • Gas vs. Oil Price Chart
    • Food Prices 1913 vs 2013
    • Health Insurance
  • Blog
    • Key Inflation Articles
    • International Inflation
    • Historical Inflation Rates for Japan (1971 to 2014)
You are here: Home » energy

AI Is Deflationary But Its Energy Demand Could Fuel Inflation

Published on July 22, 2025 by Tim McMahon Leave a Comment

AI Deflation vs Electricty

Artificial intelligence is being heralded as one of the most transformative technologies of all time, with the potential to radically improve productivity, reduce costs, and drive economic growth. But as the AI revolution unfolds, a paradox is emerging: AI has deep deflationary potential, yet its explosive demand for electricity and infrastructure introduces inflationary pressures. Understanding these contradictory forces is essential to understanding how Artificial Intelligence could shape macroeconomic trends in the coming decade. The Deflationary Power of AI AI’s primary deflationary force lies in its ability to automate tasks across every sector of the economy — from legal document … [Read more...]

Filed Under: Deflation Tagged With: AI, Artificial Intelligence, deflation, energy, inflation

Inflation Less Than Experts Predict in March

Published on April 13, 2023 by Tim McMahon Leave a Comment

Annual Inflation Rate 2010-Mar2023

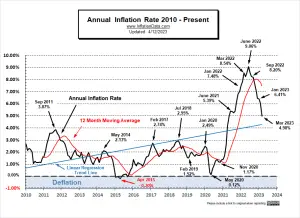
Annual inflation PLUNGED in March according to the Bureau of Labor Statistics CPI report released on April 12th.  Monthly inflation was 0.33% for March 2023, compared to 1.34% in March 2022. This resulted in a 1% drop in Annual inflation. But despite the significant drop in inflation, the stock market did not rally. Instead, the NYSE lost a few points, and the NASDAQ lost just over 100 points. March 2023 Inflation Summary: Annual Inflation fell from 6.04% to 4.98% CPI Index rose from 300.840 to 301.836 Monthly Inflation for March was 0.33% Next release May … [Read more...]

Filed Under: Inflation Tagged With: 2023, BLS, CPI, energy, March Inflation, oil

Inflation Expectations and the Massive Fed Stimulus

Published on April 8, 2020 Updated on March 31, 2021 by Guest Author Leave a Comment

Fed Assets Apr 2020

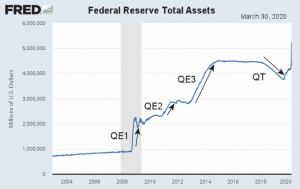
Inflation is loosely described as a general economic state of rising prices. In February 2020, the US inflation rate dipped from a high of 2.5% in January, to 2.3%. Assuming the standard of steadily increasing prices, driven largely by food, fuel, and living expenses, one can expect the inflation rate to tick higher. Forecasts for April 2020 are at 1.7%. Given that the major drivers of inflation are excess demand (demand-pull inflation), or cost-push inflation, current conditions based on Coronavirus quarantines have created a murky demand climate. Oil Prices and Inflationary Expectations All major US indices, including the Dow Jones Index, have plunged precipitously. Stock portfolios … [Read more...]

Filed Under: The Federal Reserve Tagged With: Cheap Money, Coronavirus, Covid, COVID-19, economy, energy, FED, inflation, oil, oil prices, pandemic, quantitative easing, stimulus

Oil Price Inflation Charts and Tables Updated

Published on March 13, 2019 by Tim McMahon Leave a Comment

Average Monthly Crude Oil Prices

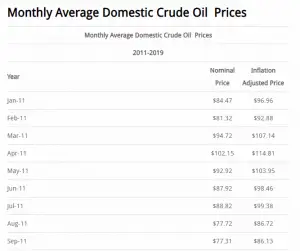
Oil Price Inflation This month we have updated the Crude Oil Inflation Chart which shows historical crude oil prices and also what they would be if you adjusted them for inflation as of February 2019. We have also updated the Annual Crude Oil Prices Table and the Monthly Crude Oil Prices Table both of which also show prices adjusted for inflation.  The nominal price of a barrel of oil was only $1.37 back in 1946 but the inflation adjusted price of oil was $18.92 per barrel.  (The nominal price is the price you would have actually paid at the time). The major peaks occurred in December 1979, October 1990, and June 2008 at $125.23, $65.68, and $145.93 respectively (all inflation adjusted to … [Read more...]

Filed Under: Energy Tagged With: Annual, crude, energy, inflation, Monthly, oil

October Inflation Up Slightly

Published on November 15, 2018 by Tim McMahon Leave a Comment

October BLS CPI Table

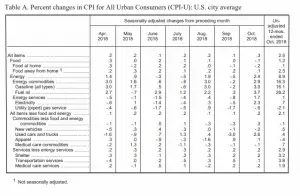
The U.S. Bureau of Labor Statistics (BLS) released their monthly Consumer Price Index report on November 14th 2018, for the 12 month period through the end of October. Annual Inflation is Up Annual inflation was  2.52% in October up from 2.28% in September.  CPI was 252.885 in October up from 252.439 in September, and 252.146 in August. Monthly Inflation for October was 0.18%, 0.12% in September, compared to -0.06% in October 2017. Next release December 12th Monthly Inflation: According the the BLS Commissioner's report: "The Consumer Price Index for All Urban Consumers (CPI-U) increased 0.3 percent in October on a seasonally adjusted basis after rising 0.1 percent in … [Read more...]

Filed Under: BLS Tagged With: 2018, BLS, CPI, CPI-U, energy, food, housing, inflation, October

Falling Oil Prices: Worrying Trend or Saving Grace?

Published on September 15, 2011 Updated on February 18, 2014 by Casey Research Leave a Comment

By Marin Katusa, Casey Energy Team When oil prices start to decline, investors and economists get worried. Oil prices in large part reflect global sentiment towards our economic future – prosperous, growing economies need more oil while slumping, shrinking economies need less, and so the price of crude indicates whether the majority believes we are headed for good times or bad. That explains the worry – those worried investors and economists are using oil prices as an indicator, and falling prices indicate bad times ahead. But oil prices have to correct when economies slow down, or else high energy costs drag things down even further. And the current relationship between oil prices and … [Read more...]

Filed Under: Energy Tagged With: energy, oil expense indicator, oil prices

Is Natural Gas Cheap?

Published on August 12, 2009 Updated on September 20, 2017 by Casey Research

Estimated Recoverable NG for Select Shale Basins

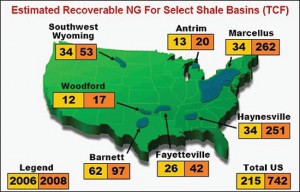
By David Galland, Casey Research At the height of its late 2005 rally, natural gas in the U.S. was selling for just over $16/MMBtu, 350% higher than today’s price of $3.56. The oil/gas ratio, now over 18, is an all-time high… suggesting that natural gas is dirt cheap. So, it’s a buy, right? In a phrase, not exactly. According to a recent report by Natural Gas Intelligence, U.S. natural gas available for production “has jumped 58% in the past four years, driven by improved drilling techniques and the discovery of huge shale fields in Texas, Louisiana, Arkansas and Pennsylvania, according to a report issued Thursday by the nonprofit Potential Gas Committee (PGC).” According to the … [Read more...]

Pages: 1 2

Filed Under: Energy Tagged With: energy, natural gas

What is Core Inflation and Why Doesn’t It Include Food and Energy?

Published on February 24, 2008 Updated on December 11, 2021 by Tim McMahon 28 Comments

CPI Inflation Chart vs Core Inflation

Updated 12/11/2021 I frequently receive this question in one form or another: Why doesn't the government consider food and energy and just tracks core inflation? The core inflation rate is frequently quoted in the popular press, and this gives the general public the impression that the "government" doesn't care about (or track) the rise in the prices of food and energy. Actually, this isn't true.  The core inflation rate is simply a component of the overall inflation rate. Economists use it because seasonal factors often skew the inflation rate. For instance, a drought might cause fruit crops to fail, causing fruit prices to rise. But this rise actually has nothing to do with … [Read more...]

Filed Under: Definitions, Education, Inflation Tagged With: core inflation, energy, food, Inflation Components

Latest Posts

  • BLS Inflation Data Delayed
  • Updated Cumulative Inflation Calculator
  • Inflation-Adjusted Silver Prices
  • December Inflation Down Slightly, Not Flat
  • December 2025 Inflation Report for November
  • How Deflation Created the Middle Class
  • October Inflation Numbers Delayed
  • Why the 2.8% COLA May Fall Short of Real Inflation

Sponsored:

As a Seasoned Investor I thought I'd seen everything... But recently I discovered TradingView which has really improved the information I have at my fingertips.~ Tim McMahon, editor

TradingView gives me an edge... including powerful charting tools, real-time market data, and a global community of traders—all in one easy to use platform. It has hundreds of indicators, and even custom scripts for more advanced users, and you don't need to change Brokers just use its seamless brokerage integration... TradingView isn't just a charting tool—it's your full trading command center.

Trade smarter. Trade faster. Check Out TradingView for free.

----------

The Best Place to Buy Your Crypto

Coinbase is the largest Crypto Trading platform in the U.S. and the easiest to use. ~Tim McMahon, editor

Check out Coinbase here

Subscribe Now

eTrends Signup Form

Elliott Wave Resources

Free Elliott Wave Resources

What is Waveopedia?

Waveopedia is EWI’s free, comprehensive index of Elliott wave patterns and terms. Everyone from beginners to experts can benefit from it. It’s a great place to send your followers if they’re new to Elliott waves.

  • Deflation Hits China is the U.S. Next?

  • Why You Must Avoid the Herding Trap

  • Chasing Trends Can Cost You

  • More Education Resources

Post Archives

Home | Articles | Sitemap | Terms of Service | Privacy | Disclaimer | Advertise With Us

Copyright © 1996-2026 · Capital Professional Services, LLC · Maintained by Design Synergy Studio · Admin

Do Not Sell My Personal Information