
The Consumer Price Index was initiated during World War I (which the U.S. joined in 1917) and was later estimated back to 1913. Due to the war prices were rising rapidly as the government was pouring money into shipbuilding centers, this made it essential to have an index for calculating cost-of-living adjustments for wages. Two basic types of data are needed to construct the CPI: price data and weighting data. The price data is collected for a list of goods and services which are supposed to represent a broad selection of all goods and services. These are collected from a variety of locations for a sample of times. The items are weighted based on estimates of the percentage of a “typical” family’s budget. So even though “bedroom furniture” might be part of the index it would only carry very minimal weight because the average family wouldn’t buy it very often.
Weighting in 1917
To provide the appropriate weighting for the index, they decided it would reflect the relative importance of goods and services purchased in 92 different industrial centers in 1917–1919. Periodic collection of prices was started, and in 1919 the Bureau of Labor Statistics began publication of separate indexes for 32 cities. Regular publication of a national index, the U.S. city average began in 1921, and indexes were estimated back to 1913 using records of food prices.
The Consumer Price Index CPI from 1913 – 1919
The following table shows the Consumer Price index for the six years from 1913 through 1919. It may seem strange to have an index that begins with the number 9.8. This is because the index has been adjusted several times since then each time setting the current year to 100 and then recalculating the index for prior years to a number smaller than 100. The most recent time they reset it, rather than choosing a specific year as the “zero” period when the index would be 100 they decided to choose an average from 1982-1984 so currently no specific month or year is equal to exactly 100.
| Year | Jan- | Feb- | Mar- | Apr- | May- | Jun- | Jul- | Aug- | Sep- | Oct- | Nov- | Dec- |
| 1913 | 9.8 | 9.8 | 9.8 | 9.8 | 9.7 | 9.8 | 9.9 | 9.9 | 10.0 | 10.0 | 10.1 | 10.0 |
| 1914 | 10.0 | 9.9 | 9.9 | 9.8 | 9.9 | 9.9 | 10.0 | 10.2 | 10.2 | 10.1 | 10.2 | 10.1 |
| 1915 | 10.1 | 10.0 | 9.9 | 10.0 | 10.1 | 10.1 | 10.1 | 10.1 | 10.1 | 10.2 | 10.3 | 10.3 |
| 1916 | 10.4 | 10.4 | 10.5 | 10.6 | 10.7 | 10.8 | 10.8 | 10.9 | 11.1 | 11.3 | 11.5 | 11.6 |
| 1917 | 11.7 | 12.0 | 12.0 | 12.6 | 12.8 | 13.0 | 12.8 | 13.0 | 13.3 | 13.5 | 13.5 | 13.7 |
| 1918 | 14.0 | 14.1 | 14.0 | 14.2 | 14.5 | 14.7 | 15.1 | 15.4 | 15.7 | 16.0 | 16.3 | 16.5 |
| 1919 | 16.5 | 16.2 | 16.4 | 16.7 | 16.9 | 16.9 | 17.4 | 17.7 | 17.8 | 18.1 | 18.5 | 18.9 |
Inflation from 1913 – 1919
Inflation rates during this time period were some of the highest recorded. The United States was not the only country to suffer from high inflation during this period. From 1914-1923 Austria suffered from hyperinflation inflation in 1922 alone reached 1426% and overall the consumer price index rose by a factor of 11,836. During the same time period the well known Hyperinflation in Weimar Germany reached 1,000,000,000,000 to 1.
Note that although the CPI began in 1913 inflation rates aren’t calculated until there is a whole year of index data. This is because mathematically the inflation formula requires a year to elapse so you can calculate the difference between the two indexes.
| Year | Jan | Feb | Mar | Apr | May | Jun | Jul | Aug | Sep | Oct | Nov | Dec |
| 1913 | N/A | N/A | N/A | N/A | N/A | N/A | N/A | N/A | N/A | N/A | N/A | N/A |
| 1914 | 2.04% | 1.02% | 1.02% | 0.00% | 2.06% | 1.02% | 1.01% | 3.03% | 2.00% | 1.00% | 0.99% | 1.00% |
| 1915 | 1.00% | 1.01% | 0.00% | 2.04% | 2.02% | 2.02% | 1.00% | (0.98%) | (0.98%) | 0.99% | 0.98% | 1.98% |
| 1916 | 2.97% | 4.00% | 6.06% | 6.00% | 5.94% | 6.93% | 6.93% | 7.92% | 9.90% | 10.78% | 11.65% | 12.62% |
| 1917 | 12.50% | 15.38% | 14.29% | 18.87% | 19.63% | 20.37% | 18.52% | 19.27% | 19.82% | 19.47% | 17.39% | 18.10% |
| 1918 | 19.66% | 17.50% | 16.67% | 12.70% | 13.28% | 13.08% | 17.97% | 18.46% | 18.05% | 18.52% | 20.74% | 20.44% |
| 1919 | 17.86% | 14.89% | 17.14% | 17.61% | 16.55% | 14.97% | 15.23% | 14.94% | 13.38% | 13.13% | 13.50% | 14.55% |
Inflation Chart 1913- 1919
The following chart shows the inflation rates during the period from 1913-1919.
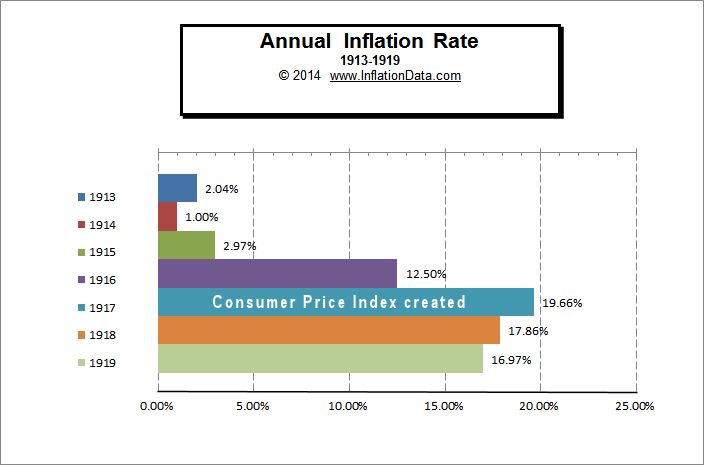
Inflation for individual years during this period varied drastically. During the period from January 1913 through January 1914 i.e. the year of 1913 was low at only 2.04%. The next year 1914 (from January 1914 through January 1915) inflation was even lower at 1%. Inflation in 1915 was 2.97% so it was really a big deal when inflation jumped up drastically during 1916 to 12.50%. During 1917 inflation was horrendous at 19.66% and this stirred a panic which led to the creation of the consumer price index in 1917. Prior to this they knew inflation was high but didn’t really know how high. Once the index was created they used food price data to recreate the index for the previous years. Inflation in 1918 was 17.86%. And in 1919 the inflation rate fell slightly to 16.97%.
Note: The Inflation rate used is the January inflation rates of the following year. Thus giving the inflation rate for the previous 12 months.
See Also:
 |
 |
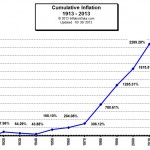 |
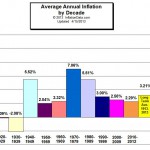
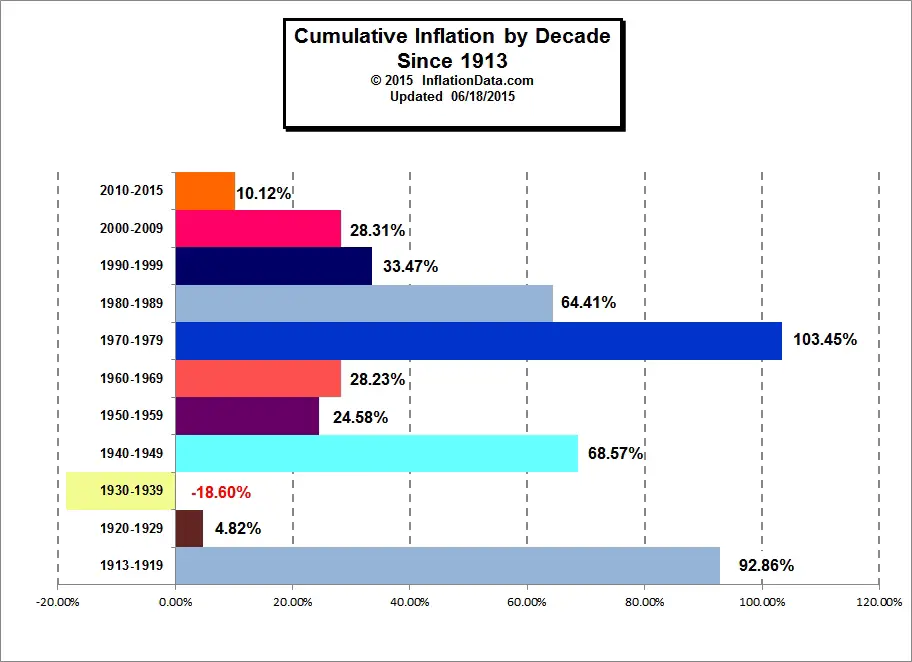
| Average Annual Inflation by Decade | Total Inflation by Decade | Total Cumulative Inflation |
- Inflation and Consumer Price Index- Decade Commentary
- WWI – The beginning of the of the CPI the Inflationary period 1913 – 1919
- The “Roaring Twenties” Inflation and Deflation 1920-1929
- The Great Depression and the Deflationary 1930′s– 1930-1939
- World War II — the volatile 1940′s– High and Low Inflation 1940-1949
- The 1950′s “Happy Days”– Inflation and CPI 1950-1959
- The 1960′s the age of possibility– Low Inflation 1960-1969
- The Inflationary 1970’s Inflation and CPI 1970-1979
- The Reagan Era Lower Inflation 1980-1989
- The Decade of Free Enterprise Inflation 1990-1999

Looking for an easily accessible CHART showing Historical CPI Data (on a monthly basis) from early 20th century (1900’s) thru current (or recent) month. Used to be very easy to find, but now it is playing “hide and seek” with me.
Typos corrected and “CPI” added.
Arnie,
If you are looking for the Bar chart that includes all the decades just go to the white bar at the top choose “inflation Charts” then “Long Term Inflation” and then “Total Inflation by Decade”. There are also a bunch of different charts on the “Long Term Inflation” page.
If you want a numerical list of all the CPI numbers since 1913 go to the white bar at the top choose “Numerical Inflation Data” and then Historical CPI. Hope this Helps.