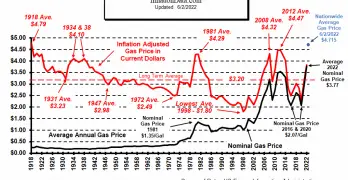
Can We Trust Government Inflation Numbers?
Independant Inflation Tracking Numbers
Updated Feb. 27, 2012
By Tim McMahon~ editor
For some reason people don’t seem to trust the government. I can’t understand why. Surely the government only has our best interests at heart and wants to take care of us like good parents, and they are just protecting us from ourselves. And of course all politicians are honest, selfless, hard-working civil servants. Right?
Well, Okay maybe they don’t always have our best interests at heart. And maybe it would benefit the budget if they didn’t have to pay so much for cost of living increases but surely they aren’t fudging the Consumer Price Index are they?
I frequently get emails, and occasionally phone calls, asking just that question. Often the conversation will go something like this: I know that a few months ago when I went to the grocery store my favorite Arnold Oatnut bread cost $2.50 and only a few months later it is costing me $2.89 so lets see that’s a 15.6% increase in six months so annual inflation must be around 31% right? And the government is telling us that inflation is less than 3.5% so they must be lying!
What is Quantitative Easing?
Quantitative Easing aka. Money Printing
Quantitative Easing aka. money printing is a government sleight of hand that results in an increase in the money supply. According to Wikipedia quantitative easing is different from the typical method whereby governments buy or sell government bonds on the open market to keep market interest rates at a specified target value. That requires a cooperative market. In unusual times, i.e. when the market is panicked, and banks don’t want to buy bonds, the central bank implements “quantitative easing” by purchasing relatively worthless financial assets from banks and loaning them new electronically created money. So this is straight forward money printing compared to the more round about tradtional method.
Thus Quantiative Easing increases the excess reserves of the banks creating liquidity for the markets.
Effects of Quantitative Easing
Legendary economist, Milton Friedman once said: “Inflation is always and everywhere a monetary phenomenon.” In other words, inflation is always caused by printing too much money. But the results are seen in prices of commodities like food, clothing and energy after the printed money works its way through the economy.
Generally, after a round of “Quantitative Easing” (aka. Money Printing) it usually takes one to two years for it to show up in popular pricing. The time lag gets smaller as people catch on to the cause and begins to anticipate more inflation. The time lag is also why many people fail to see the correlation between money printing and inflation. Continue reading
Global Debt Market: Biggest Bubble of All Time?
The Global Debt Market — The Biggest Bubble of All: This One Has Yet to Deflate (Are You Ready?)
History shows that once a financial bubble bursts, it can take a long time to bounce back.
Recent history offers an example: Real estate prices topped in 2006-2007 — then came the worst part of the sub-prime mortgage crisis in 2008.
Yet instead of recovering with the passage of time, real estate prices just keep getting worse:
Home prices dropped for the fifth consecutive month in January, reaching their lowest point since the end of 2002.
– CNNMoney, March 27
As values sink and desperation grows, the number of owners giving their timeshares away for $1 — or less — has doubled in the past year, says Brian Rogers, of Timeshare Users Group, an owner advocacy group. “There’s never been a worst time to try to sell a timeshare,” he says.
– SmartMoney, April 4
Observers have called for a bottom numerous times in the five or so years since the bubble burst.
Again, this is what can happen. Recovery can take far longer than many expect.
Real estate is just one sector of the economy. Let’s consider another sector: Continue reading
How to Speculate your Way to Success
Everybody Forced to Speculate?
According to an interview with Doug Casey, “Everybody is going to be almost forced to be a speculator to try to stay in the same place. Speculating means capitalizing on politically caused distortions in the marketplace.” ~editorHow to Speculate your Way to Success
Source: JT Long of The Gold Report (4/20/12)
So far, 2012 has been a banner year for the stock market, which recently closed the books on its best first quarter in 14 years. But Casey Research Chairman Doug Casey insists that time is running out on the ticking time bombs. Next week when Casey Research’s spring summit gets underway, Casey will open the first general session addressing the question of whether the inevitable is now imminent. In another exclusive interview with The Gold Report, Casey tells us that he foresees extreme volatility “as the titanic forces of inflation and deflation fight with each other” and a forced shift to speculation to either protect or build wealth.
The Gold Report: You told us about two ticking time bombs last September, Doug—the trillions of dollars owned outside the U.S. that could be dumped if the holders lose confidence, and the trillions of dollars in the U.S. created to paper over the 2008 liquidity crisis. It’s been six months since then. Have we averted the disaster or are we closer than ever? Continue reading
Why Deficits Are Politically Convenient
Deficits
Terry Coxon of Casey Research discusses the effects of deficits on the economy and politics. ~editorHow Far to the Wall?
By Terry Coxon, Casey Research
Decades of manipulation by the Federal Reserve (through its creation of paper money) and by Congress (through its taxing and spending) have pushed the US economy into a circumstance that can’t be sustained but from which there is no graceful exit.
With few exceptions, all of the noble souls who chose a career in “public service” and who’ve advanced to be voting members of Congress are committed to chronic deficits, though they deny it. For political purposes, deficits work. The people whose wishes come true through the spending side of the deficit are happy and vote to reelect. The people on the borrowing side of the deficit aren’t complaining, since they willingly buy the Treasury bonds and Treasury bills that fund the deficit. And taxpayers generally tolerate deficits as a lesser evil than a tax hike.
Deficits are politically convenient for a second reason. They can take a little of the sting out of a recession. That effect is transient, and it’s not strong – more like weak tea than Red Bull. But it can be enough to help a struggling politician get past the next election.
Yes, sometimes there’s a big turnover in the personnel, such as with the 2010 election, when a platoon of self-styled anti-deficit commandos parachuted into Congress. As soon as they had taken their seats, they began offering proposals to deal with the government’s trillion-dollar revenue shortfall. But none of the proposals were serious. They were merely tokens intended to make politicians wearing anti-deficit uniforms look less ridiculous. Cut a ginormous $2 billion out of this program and a great big $500 million out of that program. Reduce spending by half a trillion dollars… over ten years. Balance the budget to the penny, but later. No one proposed anything close to dealing with the deficit now. Continue reading
Inflation Adjusted Stock Prices
Adjusted Stock Price
Financial advisors will often tell us of the steady increases available only through the stock market and present us with beautiful charts showing the relentless march of the the stockmarket ever higher and to the right. But what about inflation? How does the stock market perform when inflation is taken into consideration? After we take the loss of purchasing power into account have all the gains disappeared?
When adjusting stock prices for inflation we typically use the US Bureau of Labor Statistics Consumer Price Index CPI-U. Prices are then calculated in “real” dollars. That means that the price is adjusted so that we can see what it would have cost if prices were what they are today. Today’s chart is courtesy of our friends at “Chart of the Day” and shows the inflation adjusted stock price using the DOW as the reference. The DOW however has a built in upward bias because it is not made up of the same stocks as it was in 1925. As stocks fall out of favor they are replaced by better performing ones. A better indicator of the overall market is the entire NYSE. In our Inflation Adjusted New York Stock Exchange you can see the trend for the overall stock market. ~ Tim McMahon, editor
Inflation Adjusted DOW
For some long-term perspective, today’s chart illustrates the Dow adjusted for inflation since 1925. There are several points of interest. For one, when adjusted for inflation, the bear market that concluded in the early 1980s was almost as severe as the one that concluded in the early 1930s. Also, the inflation-adjusted Dow is up 159% since its 1929 peak and trades 84% above its 1966 peak — not that spectacular of a performance considering the time frames involved. It is also interesting to note that the Dow is up 98% from its March 9, 2009 low which is actually slightly more than what the inflation-adjusted Dow gained from its 1966 peak to today. Continue reading
How to Handle an Economic Implosion
I came across some research on the subject of worry. Here’s how it was presented:
Things People Worry About:
- things that never happen – 40%
- things which did happen that worrying can’t undo – 30%
- needless health worries – 12%
- petty, miscellaneous worries – 10%
- real, legitimate worries – 8%
Of the legitimate worries, half are problems beyond our personal ability to solve. That leaves 4% in the realm of worries people can do something about.
I thought about our gigantic national debt and weak economy. These seem to fit into both subcategories of “real” worries. You can’t do much as an individual to solve the nation’s debt and economic problems, yet you can prepare for a worsening economic downtrend.
Do we see evidence for an economic turn for the worse? Continue reading
What Happens to Gold if We Enter a Recession or Depression?
By Jeff Clark, Casey Research
Mayan prophecies aside, many of the senior Casey Research staff believe that economic, monetary, and fiscal pressures could come to a head this year. The massive buildup of global debt, continued reckless deficit spending, and the lack of sound political leadership to reverse either trend point to a potentially ugly tipping point. What happens to our investments if we enter another recession or – gulp – a depression?
Here’s an updated snapshot of the gold price during each recession since 1955. Continue reading
Cost of Living: How Much of Your Budget Goes to Food?
March 26, 2012
Knowing what percentage of our cost of living is spent on food is always a good thing to know. We recently published an article by Lynn Carpenter on her Real Basket of Goods in it she compares the cost of several ordinary food items over the decades. Her weekend meal basket included “one loaf of bread, one pound of coffee, one dozen eggs, three pounds of mid-price beef, one box of Corn Flakes or Cheerios, five pounds of potatoes and one Hershey bar.” In this article she determined that over the years a minimum wage earner would have to work 9.25 hours in 1938 to buy this food. But by 1961 a minimum wage earner only had to work 3.75 hours to buy the same food. Since then the number of hours needed stayed about the same during the 1970′s but spiked to 5.5 hours in 1981 and subsequently dropped back to about 4 hours. Continue reading
Inflation Adjusted Gold vs Stocks vs Bonds
Recently our good friends at Casey research published the following chart comparing the inflation adjusted returns of Gold compared to stocks and bonds for the period 1971 through the present. From this chart we can see that as bonds fell during the late 1970′s gold rose equivalently and stocks were basically flat. During the 1980′s bonds rose and gold fell while while stocks rose slightly. During the 1990′s stocks rose sharply gold fell and Bonds were volatile but basically flat to slightly up. During the 2000′s gold was up sharply, stocks were volatile and bonds were pretty flat. Continue reading
What All Major Depressions Have in Common
Signs of deflation are visible but the public will be fooled
Deflation requires a precondition: a major societal buildup in the extension of credit (and its flip side, the assumption of debt).
– Conquer the Crash, 2nd edition (p. 88)
Has the United States met that precondition?
Well, consider that total credit market debt as a percent of U.S. gross domestic product was
- 280 percent in 1929 at the start of the Great Depression
- 380 percent in 2008
The current build-up of credit goes far beyond major — it’s unprecedented.
It’s been rising steadily for 60 years. The slope literally looks like the side of a steep mountain.
Bank credit and Elliott wave expert Hamilton Bolton studied every major depression in the U.S. In 1957, he made this observation: Continue reading


