• Home
  • Related Sites
    • Financial Trend Forecaster
      • Moore Inflation Predictor
      • NYSE Rate of Change (ROC)
      • NASDAQ Rate of Change (ROC)
      • Crypto ROC- BTC & ETH
    • Unemployment Data
      • Historical Employment Data
      • Unemployment Rate Chart
      • Labor Force Participation Rate
    • Optio Money
    • Elliott Wave University
    • More Resources
  • Definitions
    • What is Inflation?
    • What is Core Inflation?
    • Inflation vs CPI
    • What is Deflation?
    • What is Disinflation?
    • What is Agflation?
    • What is Stagflation?
    • What is Hyperinflation?
    • What is Quantitative Easing?
    • What is Quantitative Tightening?
    • What is Velocity of Money?
    • What is Fiat Currency?
    • How Do I Calculate Inflation?
    • What are “Sticky Prices” and Why Do They Matter?
  • Featured Content
  • About Us
  • Feedback
    • Sitemap
  • Subscribe Now

InflationData.com

Your Place in Cyber Space for Inflation Data

CPIWidget-Jan26
  • Numerical Inflation Data
    • Current Inflation Rate
    • Monthly Inflation Rate (Moved)
    • Historical U.S. Inflation Rates
    • Historical CPI
  • Inflation Charts
    • Ann. Inf. Rate Chart
    • Long Term Inflation >
      • Ave. Inf. by Decade
      • Total Inf. by Decade
      • Inflation 1913-1919
      • Inflation 1920-1929
      • Inflation 1930-1939
      • Inflation 1940-1949
      • Inflation 1950-1959
      • Inflation 1960-1969
      • Inflation 1970-1979
    • Cumulative Inflation
    • FED Monetary Policy and Inflation
    • Inflation and Recession
    • Confederate Inflation (1861 – 1865)
    • Misery Index
    • The 3 Stages of Inflation
    • 15-Yr Inflation Trends Chart
  • Inflation Calculators
    • Cumulative Inf. Calc.
    • How Much Would it Cost
    • Salary Inf. Calc.
    • Cost of Living Calc.
    • U.K. Inf. Calc.
    • Cost of Gas Calc.
    • Net Worth Calc.
    • Lifetime Earnings Calc.
    • Savings Goal Calc.
    • Financial Calculators
  • Inf. Adjusted Prices
    • Energy >
      • Inflation Adj. Gas Prices
      • Historical Oil Prices Chart
      • Crude Oil Price (Table)
      • Natural Gas Prices
      • Electricity Prices
      • Oil vs Gold
    • Gold >
      • Inflation Adjusted Annual Average Gold Prices
      • Gold is a “Crisis Hedge” not an  “Inflation Hedge”
      • Comparing Oil vs. Gold
    • Corn Prices
    • Education Inflation
    • Housing Prices
    • Mortgage Rates
    • NYSE Index
    • Inf. Indexed Bonds
    • Movie Revenues
    • Inflation-Adjusted Wages
  • Cost of Living
    • Calculate Cost of Living
    • Cost-of-living Adj. (COLA)
    • Consumer Price Index CPI
      • Historical CPI
      • Current CPI
      • CPI Release Dates
    • Gas Prices >
      • Cost of Gas
      • Cost of Gas Per Month
      • Gas vs. Oil Price Chart
    • Food Prices 1913 vs 2013
    • Health Insurance
  • Blog
    • Key Inflation Articles
    • International Inflation
    • Historical Inflation Rates for Japan (1971 to 2014)
You are here: Home » What is Quantitative Tightening?

What is Quantitative Tightening?

April 10, 2019 by Tim McMahon

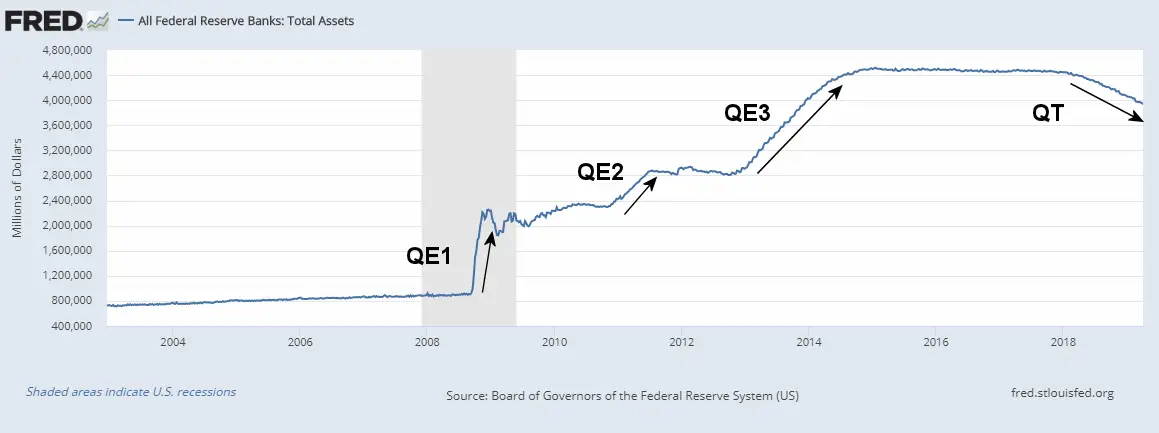
Quantitative Tightening (QT) is a contractionary monetary policy i.e. the opposite of Quantitative Easing (QE). From 2009 through 2014 the Federal Reserve (FED) engaged in three separate rounds of Quantitative Easing where the FED acquired various forms of Government and even private debt and added it to its books as “assets”. This massive Quantitative Easing led the FED to increase its balance sheet from $869 Billion to nearly $4.5 Trillion dollars predominately made up of U.S. Treasuries and Mortgage Backed Securities. The FED maintained this level of holdings by “rolling over” its investments. That is when the assets matured they reissued new ones of the same value.

Quantitative Easing is considered a new “tool” in the belt of the FED and was a last ditch effort to stem the tide in the massive contraction of the money supply in 2008-2009. It was necessary due to the massive contraction in the stock market which reduced asset values by Trillions of dollars virtually overnight thus reducing individuals and corporations “perceived wealth”. Although the stock market isn’t considered part of the money supply, individuals and corporations consider it part of their wealth and so if they see it contracting they become less likely to spend other assets.

Beginning in 2018 the FED decided that the economy was healthy enough that they could begin retiring some of that debt. Rather than selling their debt on the open market the FED decided to simply let the Government Debt it held expire and not issue new debt to replace it. This creates downward pressure on the money supply. The best way to understand both Quantitative Easing and Quantitative Tightening is to look at the Total Assets held by the FED. In the following chart we’ve added labels to the chart available from FRED to show when QE and QT occurred.

FED Assets Apr 2019

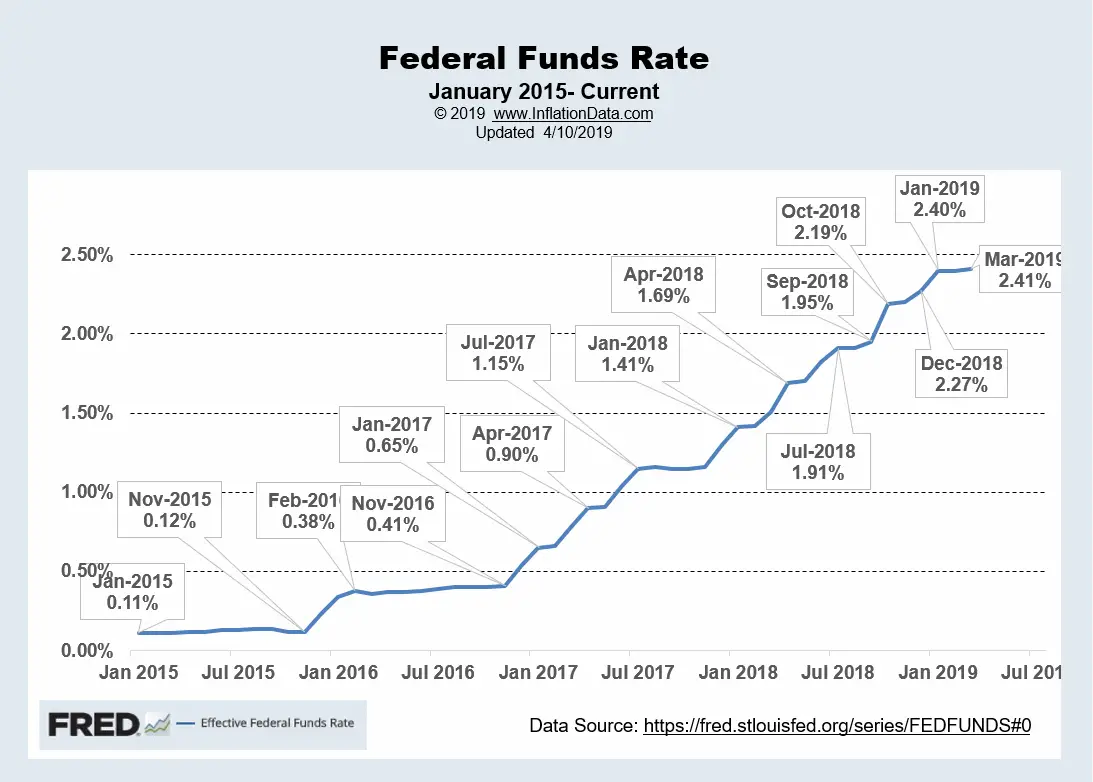
At the same time the FED also began raising interest rates. This creates similar forces to decreasing the money supply in that higher interest rates tends to cause people (and businesses) to be more reluctant to use debt to expand purchases thus reducing overall demand. In this particular instance it appears that the FED has been more aggressive in raising rates than in lowering holdings. As we can see from the above chart QT has been much more gradual (as promised by the FED) than QE was. But if we look at the chat below we see that interest rates were being raised rather aggressively in 2018 which caused the stock market to stumble in late 2018 at which point the FED stopped raising interest rates but continued with Quantitative Tightening.


Fed Funds Rate Apr 2019

You might also like:

  •  How Does Inflation Affect Foreign Exchange Rates
  • M1 Money Supply and Inflation
  • What is Velocity of Money?
  • What is Quantitative Easing?
  • What is Inflation?
  • More Definitions

About Tim McMahon

Connect with Tim on Google+.

  • Web
  • |
  • Twitter
  • |
  • Facebook
  • |
  • LinkedIn
  • |
  • More Posts(408)

Latest Posts

  • Updated Cumulative Inflation Calculator
  • Inflation-Adjusted Silver Prices
  • December Inflation Down Slightly, Not Flat
  • December 2025 Inflation Report for November
  • How Deflation Created the Middle Class
  • October Inflation Numbers Delayed
  • Why the 2.8% COLA May Fall Short of Real Inflation
  • Delayed BLS September Inflation Data Released

Sponsored:

As a Seasoned Investor I thought I'd seen everything... But recently I discovered TradingView which has really improved the information I have at my fingertips.~ Tim McMahon, editor

TradingView gives me an edge... including powerful charting tools, real-time market data, and a global community of traders—all in one easy to use platform. It has hundreds of indicators, and even custom scripts for more advanced users, and you don't need to change Brokers just use its seamless brokerage integration... TradingView isn't just a charting tool—it's your full trading command center.

Trade smarter. Trade faster. Check Out TradingView for free.

----------

The Best Place to Buy Your Crypto

Coinbase is the largest Crypto Trading platform in the U.S. and the easiest to use. ~Tim McMahon, editor

Check out Coinbase here

Subscribe Now

eTrends Signup Form

Elliott Wave Resources

Free Elliott Wave Resources

What is Waveopedia?

Waveopedia is EWI’s free, comprehensive index of Elliott wave patterns and terms. Everyone from beginners to experts can benefit from it. It’s a great place to send your followers if they’re new to Elliott waves.

  • Deflation Hits China is the U.S. Next?

  • Why You Must Avoid the Herding Trap

  • Chasing Trends Can Cost You

  • More Education Resources

Post Archives

Home | Articles | Sitemap | Terms of Service | Privacy | Disclaimer | Advertise With Us

Copyright © 1996-2026 · Capital Professional Services, LLC · Maintained by Design Synergy Studio · Admin

Do Not Sell My Personal Information