The U.S. Bureau of Labor Statistics released the Annual Inflation Rate data for the year through the end of June on July 12th 2018. Annual Inflation is Up Annual inflation rate was 2.87% in June up from 2.80% in May, 2.46% in April, 2.36% in March and 2.21% in February. CPI-U was 251.989 in June, 251.588 in May, 247.867 in January and 246.524 in December. Monthly Inflation for June was 0.16% while May was 0.42%, April was 0.40%, up from 0.23% in March 2018. June 2017 was only 0.09% Next release August 10th Monthly Inflation: Annual inflation for the 12 months ending in June was 2.87% up slightly from May's 2.80% but up sharply from April's 2.46%. Current levels are … [Read more...]
Monthly Deflation, Annual Disinflation
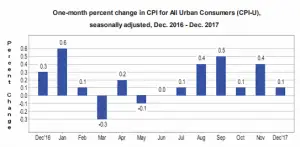
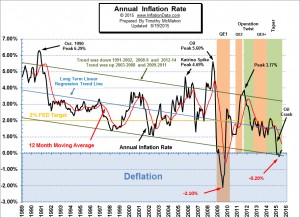
The U.S. Bureau of Labor Statistics released the Annual Inflation Rate data for the year through the end of December on January 12th 2018. Annual inflation was 2.11% for the 12 months ending in December CPI-U down slightly from 246.669 to 246.524 Monthly Inflation for December -0.06% Next release February 14th Annual Inflation Chart Annual inflation for the 12 months ending in December 2017 was 2.11% down from 2.20% in November and slightly above the 2.04% in October. Early in 2017 inflation was above current levels at 2.50% in January, 2.74% in February, 2.38% in March, and then falling to 2.20% in April. The annual cyclical low was 0.84% in July 2016. The longer term … [Read more...]
July Inflation Numbers Minimal
The Bureau of Labor Statistics (BLS) released their monthly Consumer Price Index (CPI-U) and Inflation report for the year ending in July on August 19th . Annual Inflation came in at 0.17%. That means that something that cost $100 a year ago would cost $100.17 today. That is compared to the typical inflation of around 3% which would mean that something that cost $100 last year would cost $103 this year. The BLS rounds this to .2% which of course is so small that almost any one of the deflationary months last year would cancel out all the inflation we've seen over the previous 12 months. The CPI-U index a year ago was 238.250 and is currently 238.654. We have seen significant … [Read more...]
