
The U.S. Bureau of Labor Statistics released the Annual Inflation Rate data for the year through the end of April on May 10th 2018.
Annual Inflation is Up
- Annual inflation rate was 2.46% up from 2.36% in March and 2.21% in February.
- CPI was 250.546 in April, 249.554 in March, 248.991 in February, 247.867 in January and 246.524 in December.
- Monthly Inflation for April was 0.40%, up from 0.23% in March 2018
- Next release June 12th
Monthly Inflation:
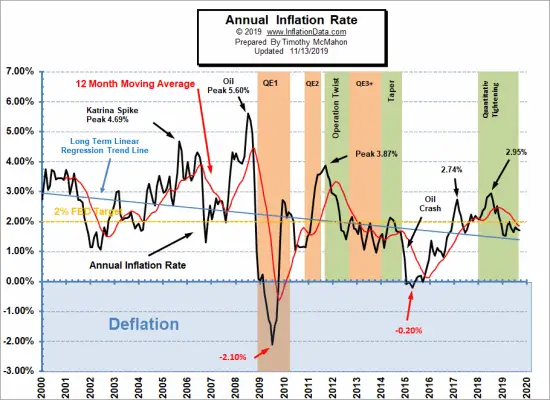
Annual inflation for the 12 months ending in April was 2.46% up from 2.36% in March. February was 2.21% and January was 2.07%. Early in 2017 inflation was 2.50% in January, 2.74% in February and 2.38% in March
Typically the monthly inflation rate is highest during the first quarter (January through March) and lowest during the last quarter (October through December). March 2018 had 0.23% monthly inflation and April 2018 had 0.40% which was below February’s 0.45% but it was above April 2017’s 0.30% so we saw an increase in the annual inflation rate (resulting in annual inflation of 2.46% compared to 2.36% in March).
Although the monthly differences seem relatively small, if we had 12 months of 0.45% inflation we would have 5.4% annual inflation but 12 months at 0.23% would only result in 2.76%. But when it is combined with lower inflation months and even some negative months the annual inflation becomes much lower.
See Annual Inflation Chart for more info.
According to the U.S. Bureau of Labor Statistics (BLS) commissioner’s report- “The Consumer Price Index for All Urban Consumers (CPI-U) increased 0.2 percent in April on a seasonally adjusted basis after falling 0.1 percent in March, the U.S. Bureau of Labor Statistics reported today. Over the last 12 months, the all items index rose 2.5 percent before seasonal adjustment. The indexes for gasoline and shelter were the largest factors in the seasonally adjusted increase in the all items index, although the food index increased as well.“
So although we calculate the annual inflation rate “before seasonal adjustment” as 2.46% up from 2.36% last month the BLS rounds it to 2.5% and then uses “Seasonally Adjusted” numbers to say the CPI-U “increased 0.2 percent”.
Misery Index
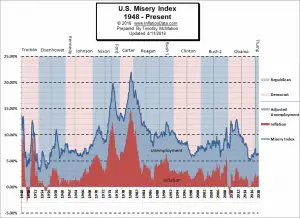 The misery index as of May 2018 (based on the most recent official government inflation and unemployment data for the 12 months ending in April) is at 6.36% down from 6.46% last month. This is due to a combination of factors. Unemployment is down sharply from 4.1% to 3.9% but inflation is up from 2.36% to 2.46%.
[Read More…]
Moore Inflation Predictor
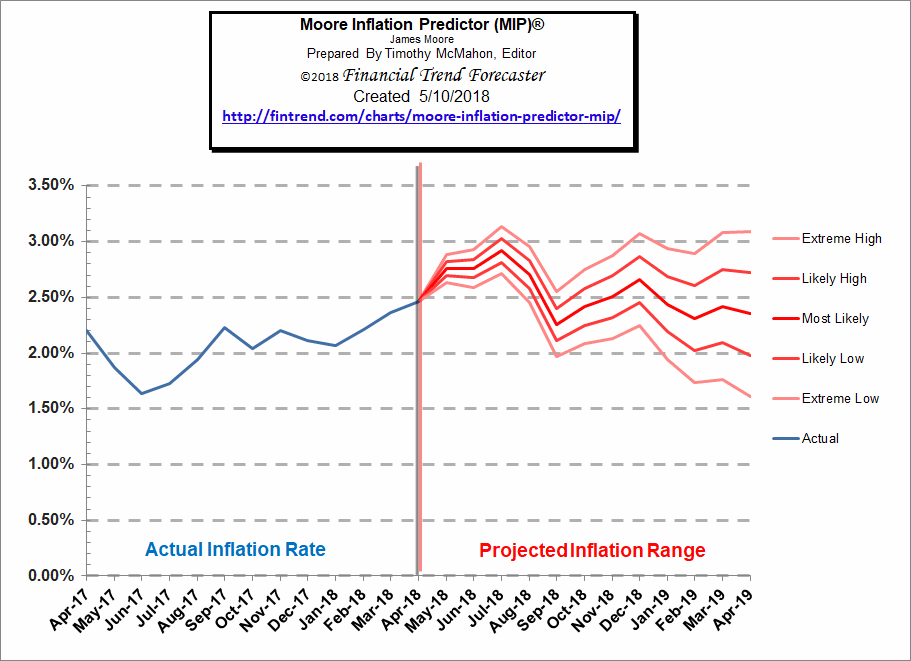
Last month our MIP Chart was projecting a mild increase and the actual line was at the very high end of our projection actually slightly below our “extreme high” which was 2.48% compared to the actual which turned out to be 2.46%. This month, the current MIP projection is sharply up possibly taking annual inflation as high as 2.89% by next month.
See Moore Inflation Forecast for more info.
NYSE Rate of Change (ROC)©
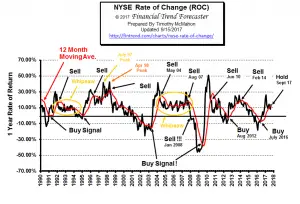
The NYSE index has entered the “Whipsaw period” being above its moving average in November, below in December, above in January, below in February, back up to the moving average in March and below once again in April. In December we said, “However at this point in the cycle we could very well be seeing a whipsaw and with the annual rate of return at 14% we wouldn’t jump to sell too quickly.” Which is why we have labeled it “Hold”.
The sell-off in April left the annual rate of return on the NYSE at 10.96% with a monthly rate of return at -2.58% but in May so far the monthly rate of return was 0.53% but the Annual return is only 9.24%. If history is any indication this “whipsaw” period could last quite a bit longer with annual rates of return hovering around current levels.
See what the falling NYSE ROC means for you now.
NASDAQ Rate of Change (ROC)©
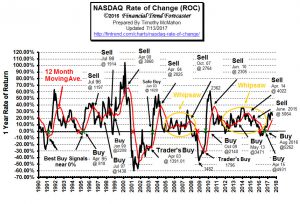
The NASDAQ continues to outperform the NYSE. The annual return for the NASDAQ is 20.01% down from 29.56% in March and 22.21% last month. Over the last month the NASDAQ is up 3.46%.
See NASDAQ ROC for more.
You Might Also Like:
From InflationData.com
- How Does Inflation Affect the Price of Gold?
- The Effects of Inflation and Interest Rates on Commodity Prices
- February Inflation Report
- Annual Inflation Rates Not Uniform Throughout the Country
- Hyperinflation: 5 Currencies that Self-Destructed
- How Oil Prices Affect Inflation
From UnemploymentData.com.
- April Unemployment Lowest Level since 2000
- 4 Careers Where Knowing How to Interpret Data Is Crucial
- Tips for Getting Ahead of the Competition in a Tough Job Market
- California at 4.3% has Lowest Unemployment Since 1976
- 5 Career Choices That Can Lead to Financial Stability
- 6 Ways to Streamline Your Job Hunt
- 4 Careers Where Military Training Can Offer a Powerful Advantage
From Financial Trend Forecaster
- When Will Electric Cars Take Over The Roads?
- Will Rising Bond Yields Send Stock Prices Tumbling?
- A New Lithium War Is About To Begin
- The Bullish And Bearish Case For Oil
- This Chart Says to Be Open to Better than Expected Market Outcomes
- Is the Current Highly Volatile Market Really Bearish?
From Elliott Wave University
- Recent Breakouts Say a Lot about Markets and Economy
- Are Wars Bullish or Bearish for Stocks?
- Tariffs May Not Slow Profit Momentum
- Was the 1,175 Point Drop in the DOW Unpredictable?
From OptioMoney.com
- The Costs of Moving: 4 Thrifty Tips to Keep Your Next Move Cheap
- How Smart Entrepreneurs Manage and Insure Their Assets
- The Average Mortgage Credit Score Is 754: How to Make Sure Yours Is Good Enough
- Frugal Finance: 5 Thrifty Tips to Lower Your Family’s Expenses
- 6 Budgeting Pointers to Get Your Finances Back on Track
From Your Family Finances
- Buying a New Car? How Your Credit Score Can Affect Your Purchase
- Top Considerations for Making Your Home Remodel Affordable
- Coin Collecting: 6 Ways to Get the Most Money out of Your Collection
- 4 Home Improvement Projects You Can Save Money On
- How To Spot Major Used Car Maintenance Issues Like A Pro

Leave a Reply