
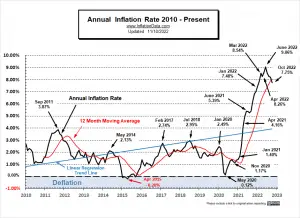
The Bureau of Labor Statistics reported that Annual Inflation for October 2022, fell from 8.20% to 7.75% Monthly inflation at 0.41% was still very high for a month in the fourth quarter, which is traditionally negative or at least very close to zero. But although high, October 2022 monthly inflation was still lower than in October 2021. So… Annual inflation for the 12 months ending in October 2022 fell to 7.75%. This was down from 8.20% in September 2022. Inflation Summary: Annual Inflation fell from 8.20% to 7.75% CPI Index rose from 296.808 to 298.012 Monthly Inflation for October was 0.41% Next release is December 13th October Annual Inflation was 7.75%. Jan. … [Read more...]
December Inflation is Up
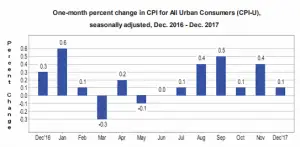
The U.S. Bureau of Labor Statistics (BLS) released its December Inflation report on January 14th, 2020, for the 12 months through the end of December 2019. December Inflation Jumps Up Annual inflation tops the 2019 high set in November at 2.05% reaching 2.29%. CPI Index in December was 256.974, November was 257.208 down from October's 257.346 Monthly Inflation for December was -0.09% up from -0.32% in December 2018. Next release February 13th The CPI index itself decreased again this month (i.e. prices were actually lower this month than last month). October's CPI Index was 257.346, November's decreased to 257.208 and December's decreased again to 256.974 but each time … [Read more...]
September Annual Inflation Down to 2.28%
The U.S. Bureau of Labor Statistics (BLS) released their monthly Consumer Price Index report on October 11th 2018, for the 12 month period through the end of September. Annual Inflation is Down Annual inflation was down from 2.70% in August and 2.95% in July to 2.28% in September. CPI was 252.439 in September, 252.146 in August, 252.006 in July and 251.989 in June. Monthly Inflation for September was 0.12%, August was 0.06%, July was 0.01%, and June was 0.16% compared to 0.53% in September 2017. Next release November 14th Monthly Inflation: Annual inflation for the 12 months ending in September was 2.28% down from 2.70% in August. "The Consumer Price Index for All … [Read more...]
August Inflation Down
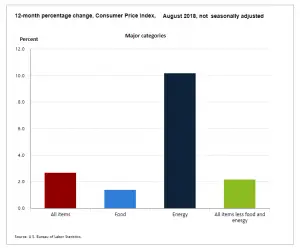
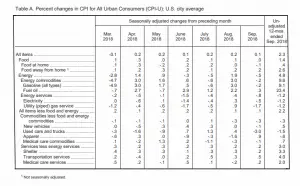
On September 13th 2018, the U.S. Bureau of Labor Statistics released their monthly Consumer Price Index report on the status of Inflation for the 12 months through the end of August. Annual Inflation is Down Annual inflation in August was 2.70% down from 2.95% in July and 2.87% in June. (BLS rounds both to 2.9%) CPI was 252.146 in August, 252.006 in July and 251.989 in June. Monthly Inflation for August was 0.06%, July was 0.01%, and June was 0.16% compared to 0.30% in August 2017. Next release October 11th Monthly Inflation: Annual inflation for the 12 months ending in August was 2.70%. 2.95% up from 2.87% in June. The U.S. Bureau of Labor Statistics (BLS) rounds … [Read more...]
Annual Inflation Up Slightly in June
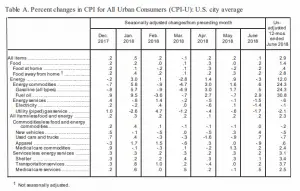
The U.S. Bureau of Labor Statistics released the Annual Inflation Rate data for the year through the end of June on July 12th 2018. Annual Inflation is Up Annual inflation rate was 2.87% in June up from 2.80% in May, 2.46% in April, 2.36% in March and 2.21% in February. CPI-U was 251.989 in June, 251.588 in May, 247.867 in January and 246.524 in December. Monthly Inflation for June was 0.16% while May was 0.42%, April was 0.40%, up from 0.23% in March 2018. June 2017 was only 0.09% Next release August 10th Monthly Inflation: Annual inflation for the 12 months ending in June was 2.87% up slightly from May's 2.80% but up sharply from April's 2.46%. Current levels are … [Read more...]
Monthly Deflation, Annual Disinflation
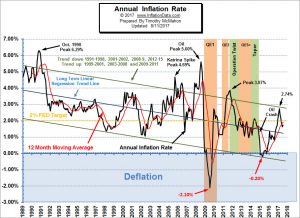
The U.S. Bureau of Labor Statistics released the Annual Inflation Rate data for the year through the end of December on January 12th 2018. Annual inflation was 2.11% for the 12 months ending in December CPI-U down slightly from 246.669 to 246.524 Monthly Inflation for December -0.06% Next release February 14th Annual Inflation Chart Annual inflation for the 12 months ending in December 2017 was 2.11% down from 2.20% in November and slightly above the 2.04% in October. Early in 2017 inflation was above current levels at 2.50% in January, 2.74% in February, 2.38% in March, and then falling to 2.20% in April. The annual cyclical low was 0.84% in July 2016. The longer term … [Read more...]
Inflation Up, NYSE New High
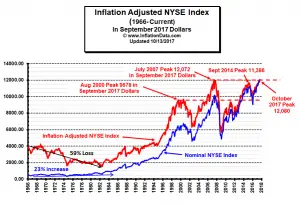
Current Inflation Situation On October 13th the Bureau of Labor Statistics released the Consumer Price Index inflation information for September. The CPI-U index was 246.819 up from 245.519 in August. This resulted in an annual inflation rate for the 12 months through September 2017 of 2.23% up from 1.94% in August, 1.63% in June and 1.73% in July. Monthly inflation was a whopping 0.53% for September primarily due to a 12% increase in gasoline prices due to refinery shutdowns in response to hurricanes. See our Annual Inflation Chart for more info. NYSE Makes New High in Inflation Adjusted Terms! To get a true picture of the state of the market it helps to look at the … [Read more...]
July CPI Down But Inflation Up
The Bureau of Labor Statistics Released the Inflation Data for the Year ending in July on August 11th. Annual inflation was 1.73% in July - Up from 1.63% in June, but down from 1.87% in May, 2.20% in April, 2.38% in March, 2.74% in February, and 2.50% in January. CPI 244.786 in July down from CPI 244.955 in June Monthly Inflation for July -0.07%, June 0.09%, May 0.09%, April was 0.30%, March was 0.08%, February was 0.31% and 0.58% in January. Next release September 14th The reason the CPI went down but inflation went up is because July 2016 monthly inflation was -0.16% and this July was less negative. So CPI goes down for the month but not as much as last year so Annual … [Read more...]
Inflation Rate Falls for April
The U.S. Bureau of Labor Statistics (BLS) released the monthly and annual Inflation numbers for April 2017. Annual inflation was 2.20% down from 2.38% in March, 2.74% in February, and 2.50% in January but above the 2.07% in December. Consumer Price Index (CPI-U) 244.524 up from 243.801 in March Monthly Inflation for April was 0.30% very close to February's 0.31% and similar to the average between March's 0.08% and January's 0.58%. Next release June 14th With Inflation falling almost 2/10ths of a percent and unemployment down one-tenth of a percent the Misery Index is down 3/10ths of a percent. The misery index helps … [Read more...]
There’s No Quick and Easy Fix for This Economy
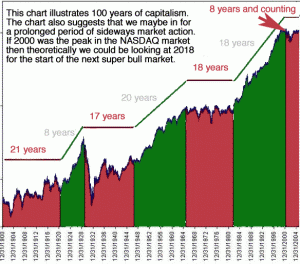
By Adam Hewison, President INO.com Regardless of what others might say, there is no quick fix for the economy. To illustrate this point, a friend of mine recently sent me a chart which I would like to share with you. This charts shows that we may be going into a prolonged period of no growth overall in the stock market. The NASDAQ peaked at 5,132.52 on March 10th, 2000. The NASDAQ market is in many ways more important than the DOW, and should be considered more of a leading indicator. If that is truly the case, then we have been in a bear market for the last eight years. … [Read more...]
