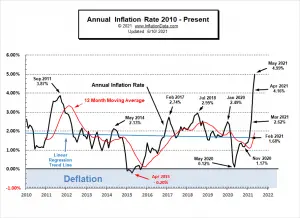
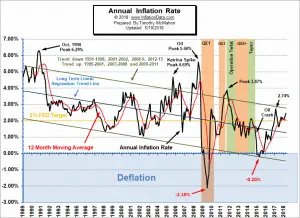
Inflation Summary: Annual Inflation up sharply to ~5% (actually 4.99%) CPI Index rose from 267.054 in April to 269.195 in May. Monthly Inflation for April was 0.82% and 0.80% in May. We have to go back to the Oil Peak of 2008 to see higher inflation. Next release July 13th Annual inflation for the 12 months ending in May was 4.99% Since February, we have been predicting Annual Inflation would shoot up in March and April due to negative numbers falling out of the annual calculation. Although May 2020 was not negative it was virtually zero so replacing it with a massive 0.80% monthly inflation caused the Annual inflation rate to soar once more. Since the BLS rounds … [Read more...]
March Inflation Skyrockets
Inflation Summary: Annual Inflation up from 1.68% in February to 2.62% in March. CPI Index rose slightly from 263.014 in February to 264.877 in March. Monthly Inflation for February was 0.55% and March was 0.71%. Next release May 12th Annual inflation for the 12 months ending in March was 2.62% We have been predicting Annual Inflation would shoot up in March due to higher gas prices and negative numbers falling out of the annual calculation. Further increases to come in April and May. Since the BLS rounds their numbers to 1 decimal place they reported February as 1.7% and March as 2.6% for a monthly increase of 9/10ths of 1% taking inflation well above the FED's 2% … [Read more...]
February Inflation Falls to 2.33%
The U.S. Bureau of Labor Statistics (BLS) released its February Inflation report on March 11th, 2020, for the 12 months through the end of February 2020. Annual Inflation Falls Annual inflation fell from the high set at 2.49% in January to 2.33% in February. CPI Index in February was 258.678 up from January's 257.971, December was 256.974, November was 257.208 down from October's 257.346 Monthly Inflation for January was 0.39%, while February was 0.27% down from 0.42% in February 2019. Next release April 10th Currently, the inflation rate is above the FED's target 2% rate. But the FED is concerned with a market meltdown due to falling Oil prices and the Coronavirus so … [Read more...]
September Annual Inflation Down to 2.28%
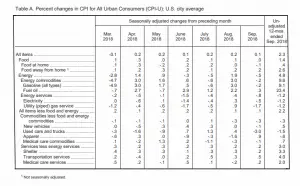
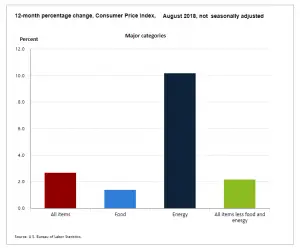
The U.S. Bureau of Labor Statistics (BLS) released their monthly Consumer Price Index report on October 11th 2018, for the 12 month period through the end of September. Annual Inflation is Down Annual inflation was down from 2.70% in August and 2.95% in July to 2.28% in September. CPI was 252.439 in September, 252.146 in August, 252.006 in July and 251.989 in June. Monthly Inflation for September was 0.12%, August was 0.06%, July was 0.01%, and June was 0.16% compared to 0.53% in September 2017. Next release November 14th Monthly Inflation: Annual inflation for the 12 months ending in September was 2.28% down from 2.70% in August. "The Consumer Price Index for All … [Read more...]
August Inflation Down
On September 13th 2018, the U.S. Bureau of Labor Statistics released their monthly Consumer Price Index report on the status of Inflation for the 12 months through the end of August. Annual Inflation is Down Annual inflation in August was 2.70% down from 2.95% in July and 2.87% in June. (BLS rounds both to 2.9%) CPI was 252.146 in August, 252.006 in July and 251.989 in June. Monthly Inflation for August was 0.06%, July was 0.01%, and June was 0.16% compared to 0.30% in August 2017. Next release October 11th Monthly Inflation: Annual inflation for the 12 months ending in August was 2.70%. 2.95% up from 2.87% in June. The U.S. Bureau of Labor Statistics (BLS) rounds … [Read more...]
Annual Inflation Up Slightly in June
The U.S. Bureau of Labor Statistics released the Annual Inflation Rate data for the year through the end of June on July 12th 2018. Annual Inflation is Up Annual inflation rate was 2.87% in June up from 2.80% in May, 2.46% in April, 2.36% in March and 2.21% in February. CPI-U was 251.989 in June, 251.588 in May, 247.867 in January and 246.524 in December. Monthly Inflation for June was 0.16% while May was 0.42%, April was 0.40%, up from 0.23% in March 2018. June 2017 was only 0.09% Next release August 10th Monthly Inflation: Annual inflation for the 12 months ending in June was 2.87% up slightly from May's 2.80% but up sharply from April's 2.46%. Current levels are … [Read more...]
April Inflation UP
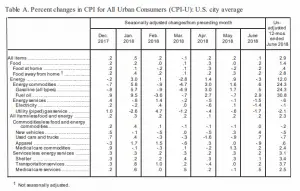
The U.S. Bureau of Labor Statistics released the Annual Inflation Rate data for the year through the end of April on May 10th 2018. Annual Inflation is Up Annual inflation rate was 2.46% up from 2.36% in March and 2.21% in February. CPI was 250.546 in April, 249.554 in March, 248.991 in February, 247.867 in January and 246.524 in December. Monthly Inflation for April was 0.40%, up from 0.23% in March 2018 Next release June 12th Monthly Inflation: Annual inflation for the 12 months ending in April was 2.46% up from 2.36% in March. February was 2.21% and January was 2.07%. Early in 2017 inflation was 2.50% in January, 2.74% in February and 2.38% in … [Read more...]
January’s Monthly Inflation 0.54%
The U.S. Bureau of Labor Statistics released the Annual Inflation Rate data for the year through the end of January on February 14th 2018. Annual inflation was 2.07% in January down from 2.11% in December CPI-U up from 246.524 to 247.867 Monthly Inflation for January 0.54% compared to 0.57% in January 2017 Next release March 13th Monthly Inflation is High, But... Typically the monthly inflation rate is highest during the first quarter (January through March) and lowest during the last quarter (October through December). January 2017 had inflation of 0.57% and so January 2018's 0.54% is right in line with that (resulting in annual inflation of 2.07%). However if … [Read more...]
Monthly Deflation, Annual Disinflation
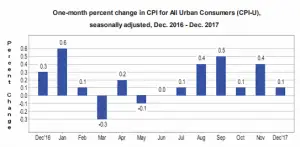
The U.S. Bureau of Labor Statistics released the Annual Inflation Rate data for the year through the end of December on January 12th 2018. Annual inflation was 2.11% for the 12 months ending in December CPI-U down slightly from 246.669 to 246.524 Monthly Inflation for December -0.06% Next release February 14th Annual Inflation Chart Annual inflation for the 12 months ending in December 2017 was 2.11% down from 2.20% in November and slightly above the 2.04% in October. Early in 2017 inflation was above current levels at 2.50% in January, 2.74% in February, 2.38% in March, and then falling to 2.20% in April. The annual cyclical low was 0.84% in July 2016. The longer term … [Read more...]
Inflation Up, NYSE New High
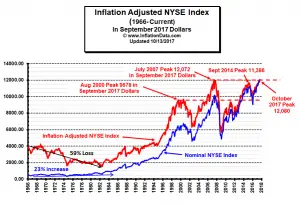
Current Inflation Situation On October 13th the Bureau of Labor Statistics released the Consumer Price Index inflation information for September. The CPI-U index was 246.819 up from 245.519 in August. This resulted in an annual inflation rate for the 12 months through September 2017 of 2.23% up from 1.94% in August, 1.63% in June and 1.73% in July. Monthly inflation was a whopping 0.53% for September primarily due to a 12% increase in gasoline prices due to refinery shutdowns in response to hurricanes. See our Annual Inflation Chart for more info. NYSE Makes New High in Inflation Adjusted Terms! To get a true picture of the state of the market it helps to look at the … [Read more...]
