The U.S. Bureau of Labor Statistics released the Annual Inflation Rate data for the year through the end of March on April 11th 2018.
Annual Inflation is Up
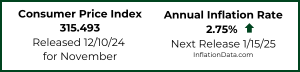
- Annual inflation rate was 2.36% up from 2.21% in February.
- CPI was 249.554 in March, 248.991 in February, 247.867 in January and 246.524 in December.
- Monthly Inflation for March 2018= 0.23%
- Monthly Inflation for March 2017= 0.08%
- Next release May 10th
Monthly Inflation:
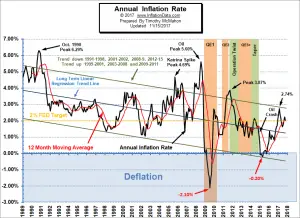 Typically the monthly inflation rate is highest during the first quarter (January through March) and lowest during the last quarter (October through December). March 2018 had 0.23% monthly inflation which was below February’s 0.45% but it was well above March 2017’s 0.08% so we saw a significant increase in the annual inflation rate (resulting in annual inflation of 2.36% compared to 2.21% in February).
If we had 12 months of 0.45% inflation we would have 5.4% annual inflation but 12 months at 0.23% would only result in 2.76%. But when it is combined with lower inflation months and even some negative months the annual inflation is much lower.
See Annual Inflation Chart for more info.
According to the U.S. Bureau of Labor Statistics (BLS) commissioner’s report- “The Consumer Price Index for All Urban Consumers (CPI-U) decreased 0.1 percent in March on a seasonally adjusted basis after rising 0.2 percent in February, the U.S. Bureau of Labor Statistics reported today. Over the last 12 months, the all items index rose 2.4 percent before seasonal adjustment. A decline in the gasoline index more than outweighed increases in the indexes for shelter, medical care, and food to result in the slight seasonally adjusted decline in the all items index. The energy index fell sharply due mainly to the 4.9-percent decrease in the gasoline index. The index for food rose 0.1 percent over the month, with the indexes for food at home and food away from home both increasing.”
So although we calculate the annual inflation rate “before seasonal adjustment” as 2.36% up from 2.21% the BLS rounds it to 2.4% and then uses “Seasonally Adjusted” numbers to say the CPI-U “decreased 0.1 percent”.
Misery Index
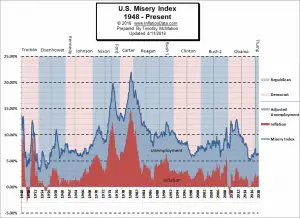 The misery index as of April 2018 (based on the most recent official government inflation and unemployment data for the 12 months ending in March) is at 6.46% (4.1% unemployment and 2.36% inflation) slightly above the 6.43% level in September 2017 but still about half of the peak of 12.87% in both October and November 2011 which was pretty miserable. With unemployment unchanged and inflation up slightly for the month, the Misery index is still well below the February 2017 peak of 7.44%. [Read More…]
Moore Inflation Predictor
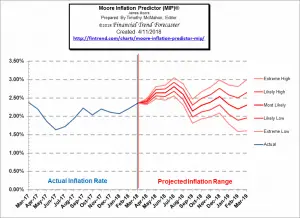
Last month our MIP Chart was projecting a sharp increase and the actual line was at the low end of our projection. This month, the MIP is projecting that April will be up less sharply than March but the upward trend will continue through August.
See Moore Inflation Forecast for more info.
NYSE Rate of Change (ROC)©
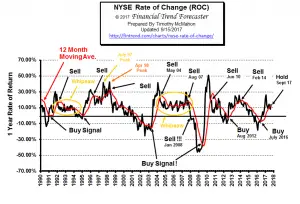
The NYSE index has entered the “Whipsaw period” being above its moving average in November, below in December, above in January, below in February, back up to the moving average in March and below once again in April. In December we said, “However at this point in the cycle we could very well be seeing a whipsaw and with the annual rate of return at 14% we wouldn’t jump to sell too quickly.” Which is why we have labeled it “Hold”.
The sell-off in February left the annual rate of return on the NYSE at 10.36% with a monthly rate of return at -4.78% but in March the Annual rate of return rebounded to 12.56% and the monthly rate of return was 2.54%. If history is any indication this “whipsaw” period could last quite a bit longer with annual rates of return hovering around current levels.
See what the falling NYSE ROC means for you now.
NASDAQ Rate of Change (ROC)©
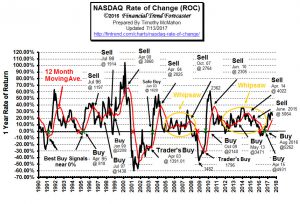
The NASDAQ continues to outperform the NYSE. The annual return for the NASDAQ is 22.21% drown from 29.56% last month. On the other hand, the NYSE is 10.96% down from 12.56% last month.
See NASDAQ ROC for more.
You Might Also Like:
From InflationData.com
- The Effects of Inflation and Interest Rates on Commodity Prices
- February Inflation Report
- Annual Inflation Rates Not Uniform Throughout the Country
- Hyperinflation: 5 Currencies that Self-Destructed
- How Oil Prices Affect Inflation
From UnemploymentData.com.
- Tips for Getting Ahead of the Competition in a Tough Job Market
- March Employment Tops 147 Million
- California at 4.3% has Lowest Unemployment Since 1976
- 5 Career Choices That Can Lead to Financial Stability
- 6 Ways to Streamline Your Job Hunt
- 4 Careers Where Military Training Can Offer a Powerful Advantage
From Financial Trend Forecaster
- Is the Current Highly Volatile Market Really Bearish?
- Is Guyana Prepared For An Oil Boom?
- Oil Market Fears: War, Default And Nuclear Weapons
- Why The Next Oil Boom Will Be Fueled By Blockchain
- A Correction or a New Bear Market?
- Clean Oil That Only Costs $20 per Barrel?
From Elliott Wave University
- Tariffs May Not Slow Profit Momentum
- Was the 1,175 Point Drop in the DOW Unpredictable?
- Urgent Message: Two Must See NASDAQ Charts
From OptioMoney.com
- The Average Mortgage Credit Score Is 754: How to Make Sure Yours Is Good Enough
- Frugal Finance: 5 Thrifty Tips to Lower Your Family’s Expenses
- 6 Budgeting Pointers to Get Your Finances Back on Track
- What Impact Does Divorce Have on Your Finances?
- How to Check Your Credit Score Before Applying for a Mortgage
From Your Family Finances
- Investing 101: 4 Tricks for Building Your Portfolio
- 4 Financial Hacks to Prepare for the Cost of Moving
- Going Out in Style: How to Retire in the Lap of Luxury
- Cranky Car? A Short Guide to Simple DIY Auto Repairs
- A Retirement Checklist: What to Do in the Year before You Retire
- 4 Money Sinkholes to Watch for as a Homeowner


Leave a Reply