
What is the velocity of money?
Simply defined, the velocity of money is the turnover in the money supply. A shop owner can measure how fast his inventory is selling by calculating “inventory turnover.” To do that, he simply calculates Total Sales ÷ Average Inventory for the period in question. See: Inventory TurnOver for more information.
But if you expand the idea of turnover to the entire country, you get the “Velocity of Money”.
Strictly speaking all the velocity of money tells us is how long people hold onto their money. But from that we can infer their motives and perceptions of the economy in general…
The Velocity of Money Calculation
To Calculate the Velocity of Money, you simply divide Gross Domestic Product (GDP) which is the total of everything sold in the country, by the Money Supply. Thus Velocity of Money= GDP ÷ Money Supply. Now there is some debate about the proper measurement of the money supply. The most restrictive measure of the money supply is M1 which basically includes short-term money i.e. money that is available immediately. So that would be cash and checking accounts, NOW accounts, and demand deposits i.e. money you can get your hands on immediately.
There is a good argument that this is the best measure of the velocity of money because you want to look for an increase in the cash people are looking to hold. If people are fearful of the economy, they want to hold cash or cash equivalents. They aren’t going to put money in a CD or long-term holding. They want it readily available. So, if they lose their job or run into a credit crunch, they will have the cash they need to continue living their lives.
In the chart below, we see the velocity of money using the M1 money supply. The grey shaded areas are official recessions, and you can see that during these periods, the velocity of money typically falls. Interestingly during those periods, GDP and the money supply itself can also be shrinking. The GDP of course, might shrink because demand for goods decreases due to people holding onto their money longer. But as people default on their debts or pay them off, the money supply itself might shrink, but that would probably be longer-term money rather than M1, so that is another reason why using M1 might be the best indicator. See How Wealth Can Simply Evaporate for more information.
Velocity of Money (VOM) Chart:
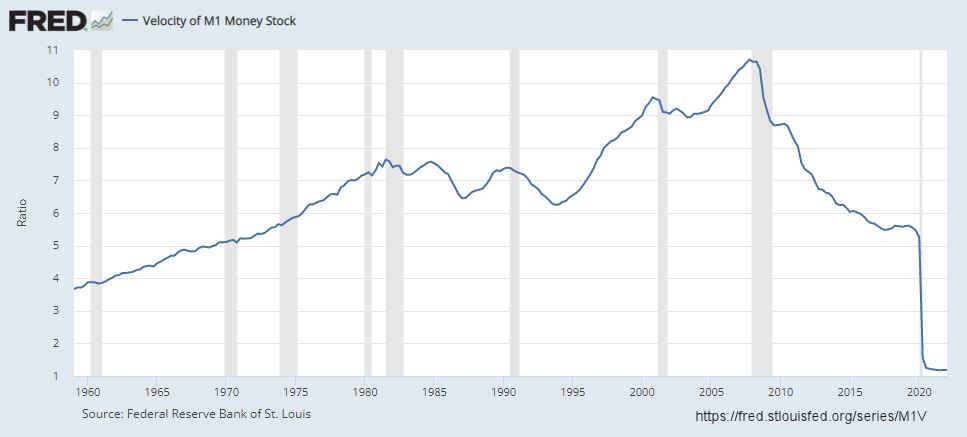
Source: https://fred.stlouisfed.org/series/M1V
Back in April of 2010, I wrote Velocity of Money and Money Multiplier – Why Deflation Is Possible
During that time, we were at the bottom of a big slide in the velocity of money chart and leaving the official recession and entering into a slight increase in the velocity of money. But as you can see from the chart from the St. Louis Federal Reserve Bank, the velocity of money continued falling from its peak in the fourth quarter of 2007 through the fourth quarter of 2017. At that point, the VOM leveled out (meaning that fear was finally dissipating) until the pandemic hit, and VOM fell off a cliff. Since Velocity of Money is such a key component of inflation, this explains why the FED would believe that inflation was transitory and they could print trillions without consequence.
What Does the Velocity of Money Tell Us?
Strictly speaking, all the velocity of money tells us is how long people actually hold onto their money. But from that, we can infer their motives and perceptions of their personal finances and, on a broader scale, the economy in general.
Typically, if people are fearful for their jobs, they will want to hold more cash, and thus the velocity of money will fall. If, on the other hand, they feel “flush with cash,” they will spend it faster. But there are other reasons people spend cash quickly. The primary one is that they fear inflation. So rather than feeling rich, a high velocity may also indicate a fear of the value of their money depreciating quickly. An extreme example of this would be the Hyperinflation in Weimar Germany between 1921 and 1923. During this time, inflation got so bad that people would pay for their meal before the meal because if they waited until the end, it would cost more. This is the ultimate in money velocity, where people rush out to spend the money because holding it for a few minutes longer might cause it to lose additional value.
What Can We Tell From the Current Falling Velocity of Money?
First of all, we can tell that the economy is not rebounding. In 2009 the velocity of money picked up a little bit. People were convinced that the recession was over and the economy would improve and so they began to spend a little bit more. This could have been the result of the QE1 stimulus. Not much in exchange for a Trillion dollars worth of debt. But the current fall resulted from a lockdown where everyone stayed home and were basically forced to spend less. They were also fed a constant diet of fear, so spending fell to a trickle, and the Velocity of Money reached unprecedented lows. The question now is, why hasn’t the velocity of money picked up again since the end of the pandemic? Most people have returned to work, restaurants are open for business, and despite a few supply hiccups, most things are readily available.
One factor is the Labor Force Participation Rate which has also not rebounded. One thing the pandemic did was to show families that two incomes are not necessarily better than one. By the time you get done paying for a second vehicle, “work clothes”, childcare, and more “food away from home,” there isn’t much left of that second paycheck. Plus, parents found that they actually enjoyed having more time to spend with their own kids, and they discovered that they weren’t all that happy with what the schools were teaching them. So many families decided to stick with the single paycheck system. But this required a bit more frugality, thus the slowing of the velocity of money.
One item to note is that the chart is only updated through the end of the first quarter of 2022. As people begin to fear higher inflation rates (which became more apparent in Q2) they may begin to spend faster in an attempt to unload depreciating currency before it becomes worth less.
You might also like:
- Velocity of Money and the Money Multiplier- Why Deflation is Possible.
- Pushing on a String, Velocity of Money and Money Multiplier Conspire Against the FED
- Inflation and Velocity of Money
- Why Money Printing Makes You Poorer
- Which is Stronger- Inflation or Deflation?

Leave a Reply