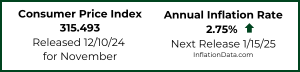
The U.S. Bureau of Labor Statistics (BLS) released their monthly Consumer Price Index report on November 14th 2018, for the 12 month period through the end of October.
Annual Inflation is Up
- Annual inflation was 2.52% in October up from 2.28% in September.
- CPI was 252.885 in October up from 252.439 in September, and 252.146 in August.
- Monthly Inflation for October was 0.18%, 0.12% in September, compared to -0.06% in October 2017.
- Next release December 12th
Monthly Inflation:
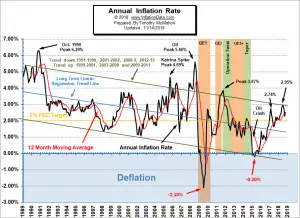
According the the BLS Commissioner’s report: “The Consumer Price Index for All Urban Consumers (CPI-U) increased 0.3 percent in October on a seasonally adjusted basis after rising 0.1 percent in September, the U.S. Bureau of Labor Statistics reported today. Over the last 12 months, the all items index rose 2.5 percent before seasonal adjustment. An increase in the gasoline index was responsible for over one-third of the seasonally adjusted increase in the all items index; advances in the indexes for shelter, used cars and trucks, and electricity also contributed. The increases in the gasoline and electricity indexes led to a 2.4-percent rise in the energy index. The food index, in contrast, declined slightly in October.”
The following table shows the changes from October for the major categories in seasonally adjusted terms and for the entire 12 months in unadjusted terms.
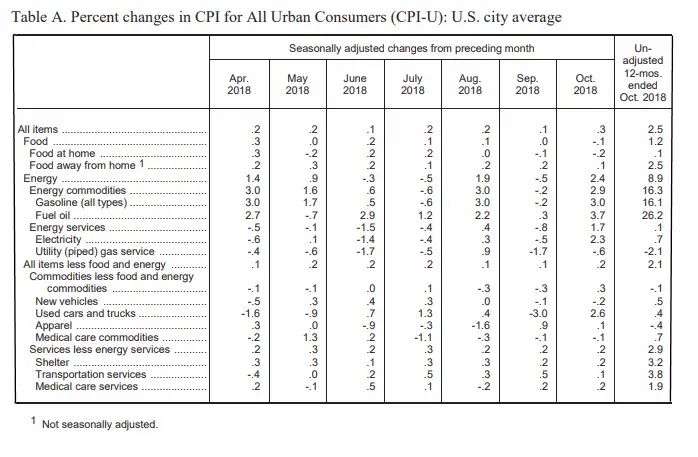
From the table we can see that on a monthly Seasonally adjusted basis Used Cars and Trucks rose 2.6% in October after falling -3.0% in September and Energy was the major gainer with Gasoline rising 3.0% while fuel oil rose 3.7%. On an annual unadjusted basis however we see that Used Cars and Trucks are up 0.4% for the entire year and Gasoline is up a whopping 16.1%. Overall, energy is up 8.9% over the year and shelter is up 3.2%. But the biggest gainer is Fuel Oil up 26.2%.
Typically the monthly inflation rate is highest during the first quarter (January through March) with April and May often being among the high months but not always.
The lowest monthly inflation is typically during the last quarter (October through December) with June through September typically being moderate.
Although the monthly differences seem relatively small, if we had 12 months of 0.42% inflation we would have 5.04% annual inflation but 12 months at 0.18% like we had in October would only result in 2.16% annual inflation. Typically, we can expect that the last quarter of the year brings the Annual inflation rate down.
See our Moore Inflation Predictor to see our current projections.
Regional Inflation Information
The U.S. Bureau of Labor Statistics also produces regional data. So if you are interested in more localized inflation information you can find it here.
Food and Energy Breakdown
The BLS publishes an index entitled “All items Less Food and Energy” which often causes people some confusion. It doesn’t mean they stopped including food and energy in the Consumer Price Index. It just means that they have broken them out so you can compare their increase to other components. In this chart we can see the effects of food, energy and all other items on the total index. For more info see What is Core Inflation?
Food
The food index declined 0.1 percent in October as the index for food at home fell 0.2 percent and the index for food away from home rose 0.1 percent. Three of the six major grocery store food group indexes declined in October. The fruits and vegetables index fell 0.7 percent in October, its third consecutive decline. The index for fresh fruits fell 1.8 percent, while the fresh vegetables index increased 0.3 percent. The index for cereals and bakery products fell 0.6 percent, and the index for dairy and related products declined 0.4 percent.
Energy
The energy index rose 2.4 percent in October after falling in September. The gasoline index increased 3.0 percent in October following a 0.2-percent decline in September. (Before seasonal adjustment, gasoline prices increased 0.6 percent in October.) The index for electricity rose 2.3 percent in October. In contrast, the index for natural gas declined, falling 0.6 percent.
Misery Index
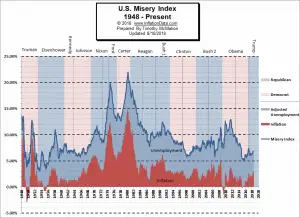
The misery index as of November 2018 (based on the most recent official government inflation and unemployment data for the 12 months ending in October) is at 6.22% up from September’s 5.98% but below the 6.60% in August, 6.85% in July, and 6.87% in June.
September’s 5.98%, was the lowest it’s been since August 2016 when it was 5.96%. However, beginning in September 2016, it jumped to 6.46% before peaking at 7.44% in February 2017.
But it is still less than half of the peak of 12.87% in both October and November 2011 which was pretty miserable. The Misery index is still well below the February 2017 peak of 7.44%. The average inflation rate since the beginning of the Misery Index in January 1948 is 3.53% which is still higher than current inflation levels… so if inflation were “average” the misery index would be higher.
[Read More…]
Moore Inflation Predictor
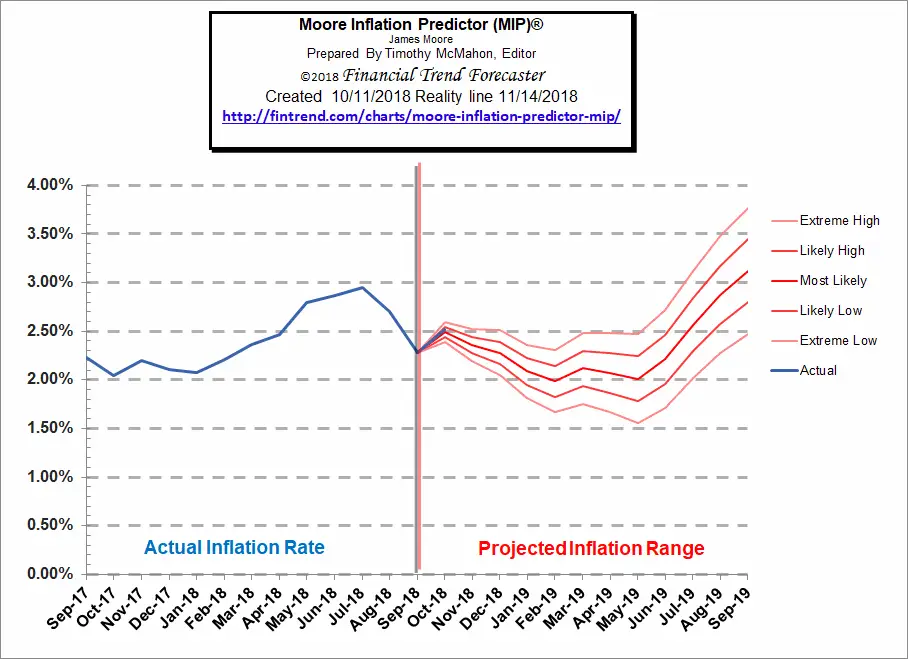
As you can see from the chart above, last month our MIP Chart was projecting a sharp increase and the actual line was right on target of our projection.
See Moore Inflation Forecast for this month’s projection.
NYSE Rate of Change (ROC)©
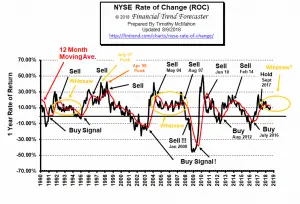
The stock market has taken a beating over the couple of months. Currently the NYSE ROC index rebounded from roughly 0% for October to0.39% in November indicating that the annual rate of return is still virtually nil. This is a difficult time to hold but this is actually quite typical for a mid-term election year…
See the NYSE ROC for more info.
NASDAQ Rate of Change (ROC)©
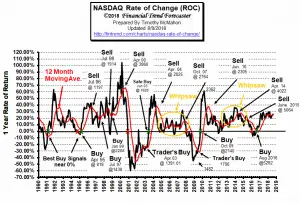 The NASDAQ continues to outperform the NYSE. NASDAQ ROC is well below its moving average, but the NASDAQ continues to outperform the NYSE with its 6.8% annual gain compared to the NYSE’s less than 1%.
See NASDAQ ROC for more.
You Might Also Like:
From InflationData.com
- Did the Democrats Really Vote Against the Social Security Cost of Living Increase?
- Can Crypto Solve Venezuela’s Hyperinflation Problem?
- Cost of Living: LA and New York vs. The World
- What Impact (if any) Does Disruption have on Inflation?
- Debt and Inflationary Pressures: A Lesson in Economic Interactivity
- What Impact (if any) Does Disruption have on Inflation?
- Inflation Risk
Read more on UnemploymentData.com.
- October Employment Hits New Record High
- How to Impress Your Interviewer After the Interview
- Arkansas, California, Idaho, South Carolina, Texas and Washington Set New Unemployment Lows in September
- Here’s Why “Strong Jobs” Don’t Mean “Higher Stocks”
- Unemployment Reaches Lowest Point Since 1969
- 5 Types of Jobs That Are Perfect for When You Can’t Decide Which Degree to Pursue
From Financial Trend Forecaster
- Move Aside Lithium – Vanadium Is The New Super-Metal
- U.S. Shale Has A Glaring Problem
- How Free is Your State?
- Oil Price Rally Boosts Electric Car Sales
- $100 Oil Is A Distinct Possibility
- Do the FED’s Interest Rates Affect the Stock Market?
- Technological Solution to 100 Year Old Oil Problem
- Are Falling Oil Prices Really Good for the Stock Market?
- 1987 vs. 2018
- BITCOIN BREAKDOWN MAY PUSH PRICES BELOW $5000
- The Psychology of Volatility
- What is the Up/Down Volume Saying About the Current Market?
From OptioMoney.com
- Risk and Reward: Why You Should Be Investing Now
- Avoiding Costly Disasters: 4 Common Home Repair Jobs for Fall and Winter
- 5 Ways to Reduce Your Business Credit Risk
- How Does a Surety Bond Differ from Insurance?
- When is the Right Time to Buy Life Insurance?
From Your Family Finances
- How Responsible Parents Care for Their Financial Future
- How Much Car Insurance Do You Really Need?
- How Real Estate Helps You Leapfrog To Wealth
- 4 Tips to Better Managing Your Finances and Assets
- Retiring to the Mountains: Enjoying Your Retirement


Leave a Reply