
The U.S. Bureau of Labor Statistics (BLS) released their monthly Consumer Price Index report on February 13th 2019, for the 12 months through January 2019.
Annual Inflation is Down
- Annual inflation in January was 1.55% down from 1.91% in December and 2.18% in November.
- January’s CPI was 251.712 up from December’s CPI of 251.233, November was 252.038
Note: January’s CPI was only slightly above the 251.588 back in May. - Monthly Inflation for January was 0.19%, December was -0.32% virtually identical to November’s -0.33%.
- Next release March 12th
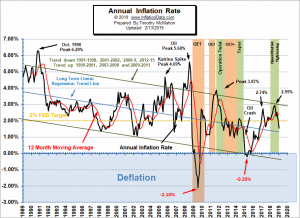 We’ve added another bar to the Annual Inflation Rate Chart indicating Quantitative Tightening (QT) check it out here. Typically the monthly inflation rate is highest during the first quarter (January through March) with April and May often being among the high months but not always. So with “only” 0.19% inflation for January 2019 is starting out with very low inflation. (January 2018 was 0.54% and January 2017 was 0.58%)
Monthly Inflation:
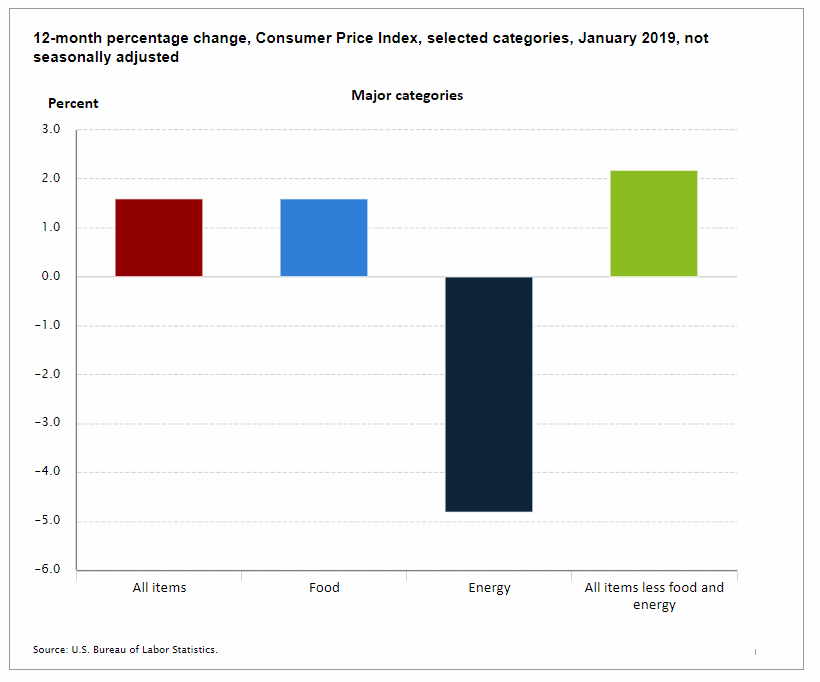
According to the BLS commissioner’s report, “In January, the Consumer Price Index for All Urban Consumers was unchanged on a seasonally adjusted basis; rising 1.6 percent over the last 12 months, not seasonally adjusted. The index for all items less food and energy rose 0.2 percent in January (SA); up 2.2 percent over the year (NSA)… The energy index declined for the third consecutive month, offsetting increases in the indexes for all items less food and energy and for food.”
In other words: On a monthly basis Seasonally Adjusted prices did not change from December to January but on an unadjusted basis they rose 0.19%.
When we have a negative monthly inflation rate that is deflationary on a monthly basis but disinflationary on an annual basis until the annual number turns negative as well then it becomes deflationary on an annual basis as well. So what happened in 2018 (and frequently happens in the 4th quarter) is that the last two months of the year (i.e. November and December) were negative, i.e. disinflationary, thus the disinflationary months of November and December wiped out all the inflation back through somewhere between April and May. But January’s inflation has brought the index back to where it was between May (251.588) and June (251.989).
Since the CPI is an index, it measures price levels. Generally as prices creep up the index goes up. If the index goes down it means that overall prices are going down (not necessarily all prices just the weighted average of all prices). The CPI-U index was 250.546 in April and prices increased so that the index was 251.588 in May and then increased incrementally up to 252.885 in October. In November the index fell to 252.038. And it fell again in December to 251.233. That means that actual prices at the end of December were somewhere between the April and May levels. But at the end of January prices were 1.55% higher compared to year ago levels.
The commissioner also reported that “Real average hourly earnings increased 1.7 percent, seasonally adjusted, from January 2018 to January 2019. The change in real average hourly earnings combined with a 0.3-percent increase in the average workweek resulted in a 1.9-percent increase in real average weekly earnings over this period.”
“Real earnings” are not the actual dollars earned but are instead dollars earned adjusted for inflation. So what this is saying is that in spite of inflation actual earning are buying 1.7% more stuff this year and workers are working a bit longer than last year so the average consumer is better off than they were a year ago.
Federal Reserve Actions
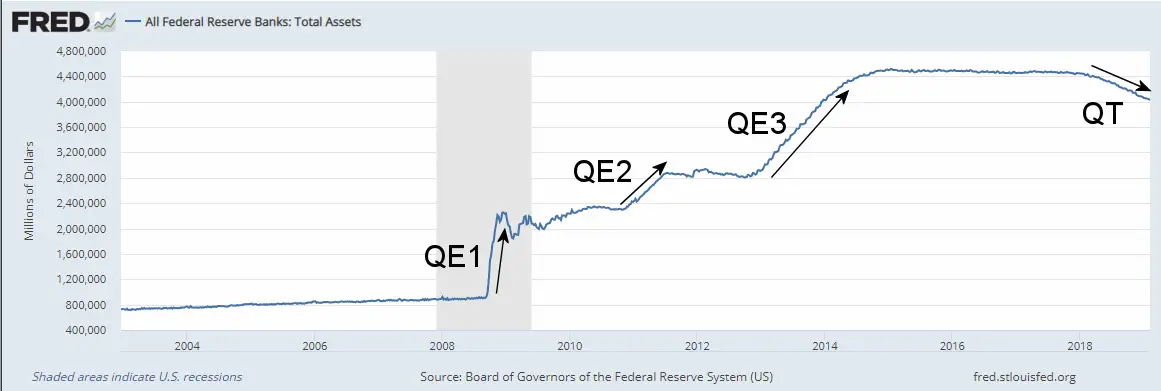
The Federal Reserve has taken a more active part in 2018 than it has in recent years both in raising interest rates and in Quantitative Tightening (QT).
Quantitative Tightening (QT) Begins
For more info See NYSE ROC and MIP.
Seasonally Adjusted Inflation Table
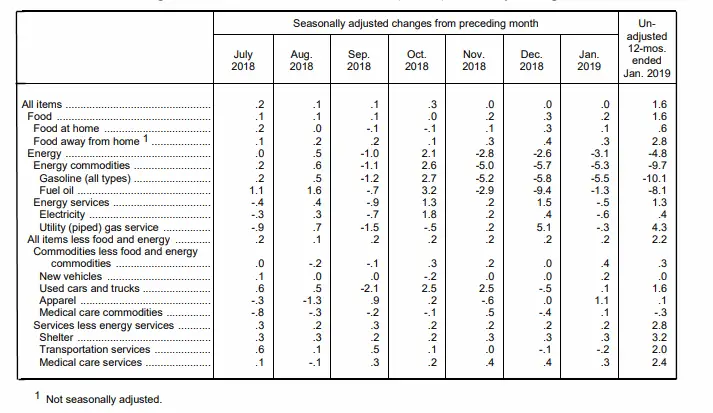
From the table above we can see that on a monthly Seasonally adjusted basis the biggest gainer is Apparel while Gasoline was actually down -10.1% in a single month.
The lowest monthly inflation is typically during the last quarter (October through December) with June through September typically being moderate. Surprisingly, July came in negative in both 2016 and 2017. There was not a single negative July from 1950 through 2000 but there have been several since.
Inflation Forecast
Last month we projected a sharply falling inflation rate inflation didn’t quite fall as much as we projected.
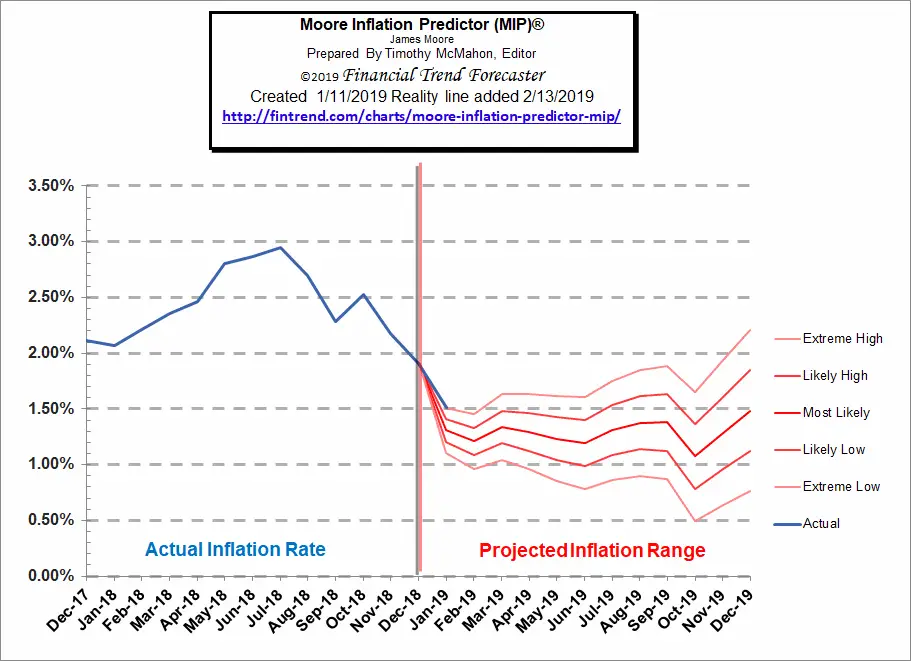
See our Moore Inflation Predictor to see our current projections.
Not Seasonally Adjusted Monthly Inflation Rates
| Jan | Feb | Mar | Apr | May | Jun | Jul | Aug | Sep | Oct | Nov | Dec | |
| 2016 | 0.17% | 0.08% | 0.43% | 0.47% | 0.41% | 0.33% | (0.16%) | 0.09% | 0.24% | 0.12% | (0.16%) | 0.03% |
| 2017 | 0.58% | 0.31% | 0.08% | 0.30% | 0.09% | 0.09% | (0.07%) | 0.30% | 0.53% | (0.06%) | 0.00% | (0.06%) |
| 2018 | 0.54% | 0.45% | 0.23% | 0.40% | 0.42% | 0.16% | 0.01% | 0.06% | 0.12% | 0.18% | (0.33%) | (0.32%) |
| 2019 | 0.19% |
See: Monthly Inflation Rate for more information and a complete table of Unadjusted Monthly Rates.
Not Seasonally Adjusted Annual Inflation (by Category)
| Category | Annual |
| All Items | 1.55% |
| Food | 1.6% |
| Energy | -4.8% |
| All Items less Food and Energy | 2.2% |
| Apparel | 0.1% |
| New Vehicles | 0.0% |
| Used Cars and Trucks | 1.6% |
| Shelter | 3.2% |
| Medical Services | 2.4% |
| Transportation Services | 2.0% |
Regional Inflation Information
The U.S. Bureau of Labor Statistics also produces regional data. So if you are interested in more localized inflation information you can find it here.
| AL | AK | AR | AZ | CA | CT | CO | DC | DE | FL | GA | GU | HI | IA |
| ID | IL | IN | KS | KY | LA | MA | MD | ME | MI | MN | MO | MS | MT |
| NC | ND | NE | NH | NJ | NM | NV | NY | OH | OK | OR | PA | PR | RI |
| SC | SC | SD | TX | UT | VA | VI | VT | WI | WA | WI | WV |
Food and Energy Breakdown
The BLS publishes an index entitled “All items Less Food and Energy” which often causes people some confusion. It doesn’t mean they stopped including food and energy in the Consumer Price Index. It just means that they have broken them out so you can compare their increase to other components. In this chart we can see the effects of food, energy and all other items on the total index. For more info see What is Core Inflation?
Misery Index
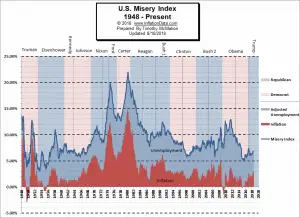
The misery index as of February 2019 (based on the most recent official government inflation and unemployment data for the 12 months ending in January) is at 5.55% down from 5.81% in December and from 5.88% in November.
[Read More…]
NYSE Rate of Change (ROC)©
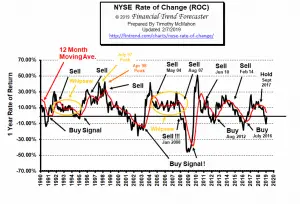 The stock market has taken a beating over the couple of months.in response to
FED Tightening throughout 2018.
This month we discuss the FED actions, Reversals And Counter-trend Moves, and current Support and Resistance lines.
See the NYSE ROC for more info.
NASDAQ Rate of Change (ROC)©
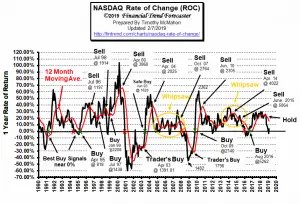 The NASDAQ moved below its moving average but above the Zero line. The ANNUAL rate of return for the NASDAQ ROC rebounded sharply this month currently at +4.08% for the last 12 months. So with a 4% positive annual rate of return the NASDAQ is looking much better than the NYSE which is still in the Red over the last 12 months.
See NASDAQ ROC for more.
You Might Also Like:
From InflationData.com
- Health Insurance Inflation
- Are Deflationary Forces Taking Hold Again?
- Gold as an Investment
- 2018 Ends with More Disinflation
- How Inflation and Interest Rates Relate
- Why Inflation Matters to Small Businesses
Read more on UnemploymentData.com.
- Bring Ideas to Life! 3 Tips for Entrepreneurs
- Like to Be on the Move? 4 High-Paying Transportation Careers
- January Employment the Good and Bad
- Joining the Workforce: 9 Licenses and Certifications that Don’t Require a College Degree
- College Not for You? 4 Promising Alternatives to Earning a Four-Year Degree
From Financial Trend Forecaster
- Saudi Arabia: We’ll Pump The World’s Very Last Barrel Of Oil
- Renewable Energy Trends in 2019
- Huge Backlog Could Trigger New Wave Of Shale Oil
- Move Aside Lithium – Vanadium Is The New Super-Metal
- U.S. Shale Has A Glaring Problem
- How Free is Your State?
From Elliott Wave University
- Has the FED Hit the Launch Button for the Stock Market?
- How to Build Consistent Trading Success
- Reversals And Counter-trend Moves Typically Take Time To Develop
- Interest Rates Win Again as Fed Follows Market
- Watch This Indicator for Approaching Volatility
- 1987 vs. 2018
- The Psychology of Volatility
From OptioMoney.com
- Medical Equipment Costs: How to Deal with Abrupt Healthcare Expenses
- Home Repairs You Should Think about Saving up For
- How to Teach Your Children to Save Money from a Young Age
- Money-Saving Upgrades: 3 Home Investments to Help Your Wallet
- Want to Boost Your FICO Score? 4 Easy Steps to Help Make That Happen
- Big Family Getting Expensive? 4 Ways to Stay in the Green
From Your Family Finances
- Make Extra Money while Going to College
- 4 Ways You Can Reduce Healthcare Expenses
- Biggest Budgeting Challenges when Decorating a Home
- 4 Sources of Quick Cash
- Car Repair on a Budget
- How to Develop a Millionaire Mindset

Leave a Reply