
The U.S. Bureau of Labor Statistics released the Annual Inflation Rate data for the year through the end of June on July 12th 2018.
Annual Inflation is Up
- Annual inflation rate was 2.87% in June up from 2.80% in May, 2.46% in April, 2.36% in March and 2.21% in February.
- CPI-U was 251.989 in June, 251.588 in May, 247.867 in January and 246.524 in December.
- Monthly Inflation for June was 0.16% while May was 0.42%, April was 0.40%, up from 0.23% in March 2018. June 2017 was only 0.09%
- Next release August 10th
Monthly Inflation:
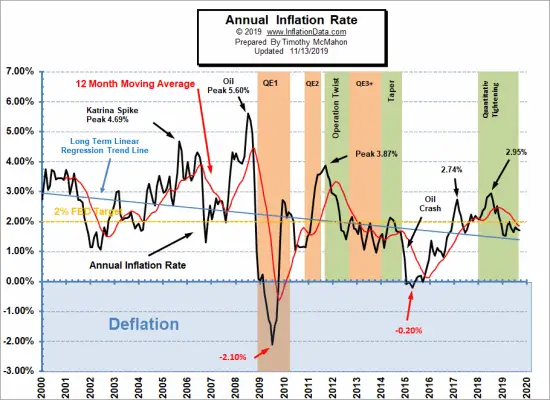
Annual inflation for the 12 months ending in June was 2.87% up slightly from May’s 2.80% but up sharply from April’s 2.46%. Current levels are testing the top of the downward channel so any significant move up from here could indicate that the long term down trend is ending. The primary factors were the food index which increased 0.2 percent in June, with the indexes for food at home and food away from home both rising 0.2 percent. Despite a 0.5-percent increase in the gasoline index, the energy index declined 0.3 percent, with the indexes for electricity and natural gas both falling. See Annual Inflation Chart for more info.
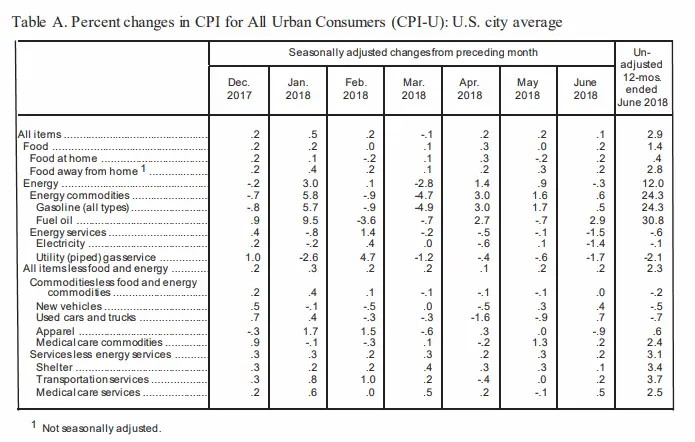
The following table shows the changes from the preceding month for the major categories in seasonally adjusted terms and for the entire 12 months in unadjusted terms.
Typically the monthly inflation rate is highest during the first quarter (January through March) with April and May often being among the high months but not always. Last year May was exceptionally low while this year was higher.
The lowest monthly inflation is typically during the last quarter (October through December) with June through September typically being moderate. Last year’s summer months were exceptionally low however so even if they are replaced with moderate months this year we could see annual inflation creeping up.
Although the monthly differences seem relatively small, if we had 12 months of 0.42% inflation we would have 5.04% annual inflation but 12 months at 0.23% would only result in 2.76% annual inflation. But when higher months are combined with lower inflation months and even some negative months the annual inflation becomes much lower. So we can hope that the last quarter of this year brings the inflation rate back down. Currently our Moore Inflation Predictor is projecting that the annual inflation rate will rise above 3% over the next couple of months before falling back below toward year’s end.
The U.S. Bureau of Labor Statistics Commissioner reported “Over the last 12 months, the all items index rose 2.8 percent before seasonal adjustment. The indexes for gasoline and shelter were the largest factors in the seasonally adjusted increase in the all items index, as they were in April. The gasoline index increased 1.7 percent, more than offsetting declines in some of the other energy component indexes and led to a 0.9-percent rise in the energy index. The medical care index rose 0.2 percent. The food index was unchanged over the month. The index for all items less food and energy rose 0.2 percent in May. The shelter index rose 0.3 percent in May. The indexes for new vehicles, education and communication, and tobacco increased in May, while the indexes for household furnishing and operations, and used cars and trucks fell. The indexes for apparel, recreation, and personal care were unchanged.”
Misery Index
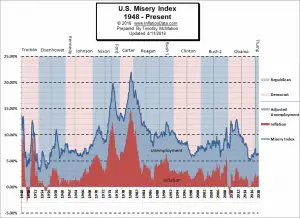 The misery index as of July 2018 (based on the most recent official government inflation and unemployment data for the 12 months ending in June) is at 6.87% up from 6.60% last month. This is due to a combination of factors. Unemployment is down slightly from 4.1% in March to 4.0% in June but during the same period inflation is up from 2.36% to 2.87%.
[Read More…]
Moore Inflation Predictor
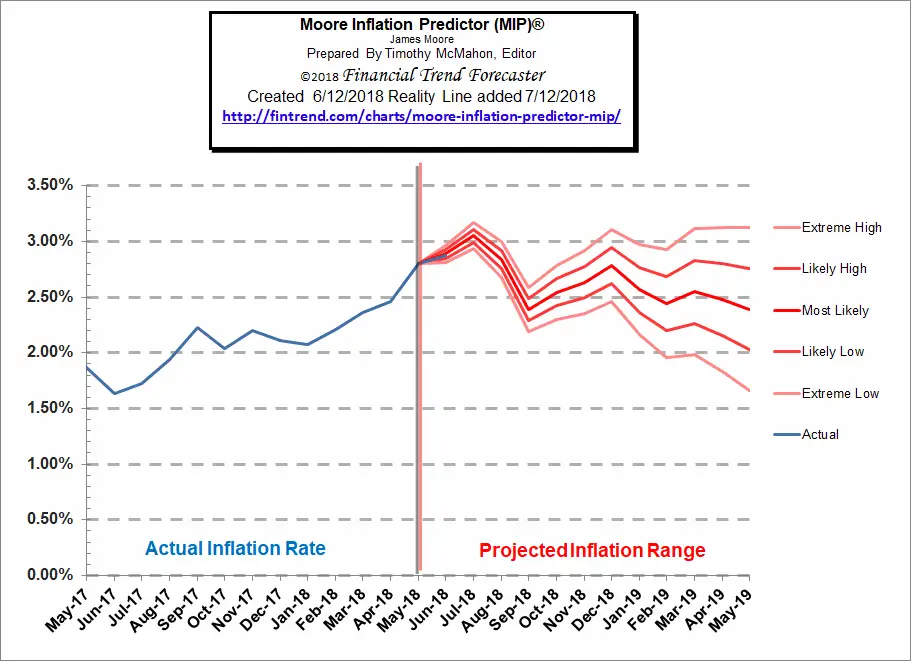
As you can see from the chart above, last month our MIP Chart was projecting a moderate increase and the actual line was right on target with our projection.
See Moore Inflation Forecast for this month’s projection.
NYSE Rate of Change (ROC)©
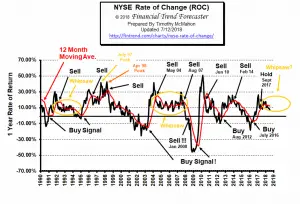
The NYSE index has entered the “Whipsaw period” in September 2017 being above its moving average in November, below in December, above in January, below in February, back up to the moving average in March below once again in April and falling further in May and June. In July it has moved further below its moving average looking very weak. We have seen similar divergences in previous whipsaws, notably in November of 2005 and June of 2006.
See what the falling NYSE ROC means for you now.
NASDAQ Rate of Change (ROC)©
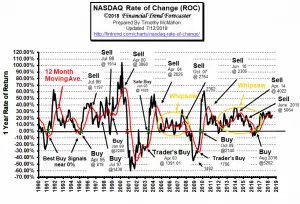
The NASDAQ continues to outperform the NYSE. The annual return for the NASDAQ is 24.61% up from 23.14% last month and 20.01% the previous month. On the other hand, the NYSE is 7.63% down from 8.99% last month and 9.24% the previous month.
See NASDAQ ROC for more.
You Might Also Like:
From InflationData.com
- What Impact (if any) Does Disruption have on Inflation?
- Debt and Inflationary Pressures: A Lesson in Economic Interactivity
- Annual Inflation Up Sharply in May
- Inflation Risk
Read more on UnemploymentData.com.
- Why Business Perception is Important
- Landing a Good Job Teaching ESL
- How to Know It’s Time to Start Your Own Business
- Tips for Kicking Off Your Trucking Career
- 4 Tips for Young Professionals Just Starting out
From Financial Trend Forecaster
- 3 Breakthrough Technologies Changing The Energy Sector
- Can Saudi Arabia Prevent The Next Oil Shock?
- IEA: High Oil Prices “Taking A Toll” On Demand
- A New Lithium War Is About To Begin
- When Will Electric Cars Take Over The Roads?
From Elliott Wave University
- Recent Breakouts Say a Lot about Markets and Economy
- Are Wars Bullish or Bearish for Stocks?
- Tariffs May Not Slow Profit Momentum
- Was the 1,175 Point Drop in the DOW Unpredictable?
From OptioMoney.com
- How to Survive Bankruptcy
- How to Lower the Chances of Bankruptcy as a Personal Business Owner
- How to Handle Medical Bill Debt
- The Costs of Moving: 4 Thrifty Tips to Keep Your Next Move Cheap
- How Smart Entrepreneurs Manage and Insure Their Assets
From Your Family Finances
- 4 Financial Planning Tips for Parents
- How to Save Money on Utilities Comfortably
- Home Office Ideas: Turn a Spare Room into Your Dream Workspace
- Diversification: The Simple Secret to Building Your Wealth
- Money in Your Twenties: 5 Reasons You Need a Financial Planner

Leave a Reply