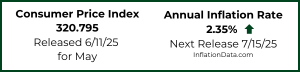
FED actions greatly affect the rate of inflation. The Federal Reserve Act of 1977 modified the original act that established the Federal Reserve in 1913 and redefined its role to not only manage fiscal policy but to also try to maintain “maximum employment”. This was termed their “Dual Mandate”, so in addition to stable prices, and moderate long-term interest rates the FED was charged with trying to create jobs (through monetary policy). This change was necessary to clarify that low inflation was not the only goal, if it was at the expense of jobs creation. After a decade of low inflation, the FED changed its policy goals in 2020, to not just balance jobs and inflation but to actually prioritize Job creation over low inflation.
May 2025 Summary:
- FED Assets are still declining (i.e. Quantitative Tightening)
- M2 Money supply is rising
- FED Funds Rate 4.33% unchanged from January
FED Actions
In April 2020, the FED began to fight Deflation with a massive Quantitative Easing program and near-zero Fed Funds rates, and by June, the FED showed signs of slacking off. However, it continued to increase assets and keep interest rates very low until February 2022. With inflation at over 7% (i.e., well over the FED target of 2%), they finally decided to curtail their massive stimulus.
In April 2020, we published the March FED Assets chart and said that FED assets could easily reach 9 Trillion…
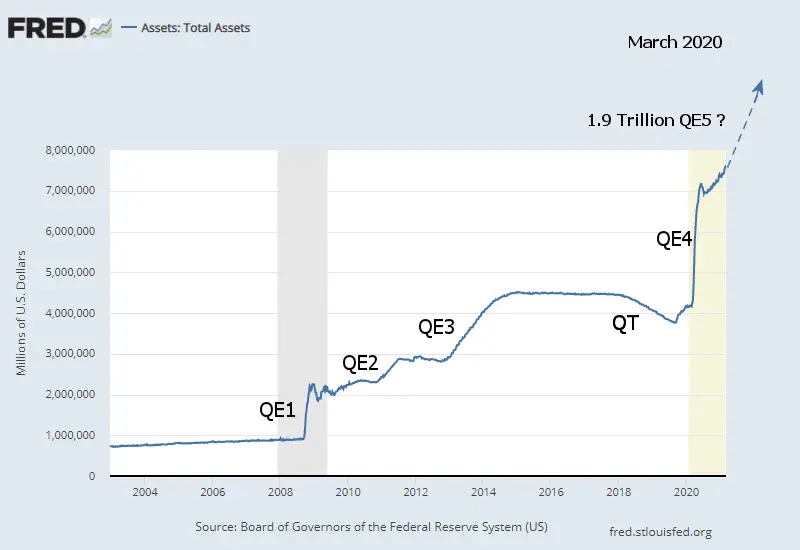 And two years later, that is precisely what happened. FED assets peaked at 8.965 Trillion on April 13th, 2022. By December 7th, FED assets had decreased to 8.582 Trillion, and on March 1st, they bottomed at 8.39 Trillion, for roughly a 2/3 Trillion decrease.
But then a banking crisis broke out in California, and the FED jumped Funds back up, wiping out roughly 38% of the gains they made. Since then, the FED has been decreasing assets again. In July 2023, it broke below the March 2023 low, hitting 8.298 trillion.
As of June 2025, FED assets are down to 6,672,885 million (6.67 Trillion) or basically, back to April 2020 levels. On March 5th, FED assets were down to
QE5 was totally unnecessary, and the FED has now sopped up the excess liquidity it created and is beginning to cut into QE 4’s liquidity. So far, the FED has been able to reduce Assets without rapidly crashing the market, and recently, we have even seen signs of new life in the market.
M2 Money Supply
 Looking at the M2 money supply, we get a slightly different picture. Here we see a steady growth of the money supply from 2009 through 2020 (#1), then a sharp spike as we saw with FED assets (#2), and then a slightly less sharp incline (#3) (but longer duration for QE 5) taking M2 to 22 Trillion dollars in 2022. From 2022 to 2023 (#4) we see the decline we would expect due to the reduction of FED assets…
BUT… rather than continuing to decline in 2023 through 2025 as FED assets do, M2 returns to the same slope of increase as from 2012-2020 (#5), despite FED assets declining. This could be the reason for the rebound in the stock market, beginning at about the same time as this uptick in M2. The more money sloshing around in the system, the more that finds its way into the stock market.
Source: FRED M2 Money Supply
Global M2
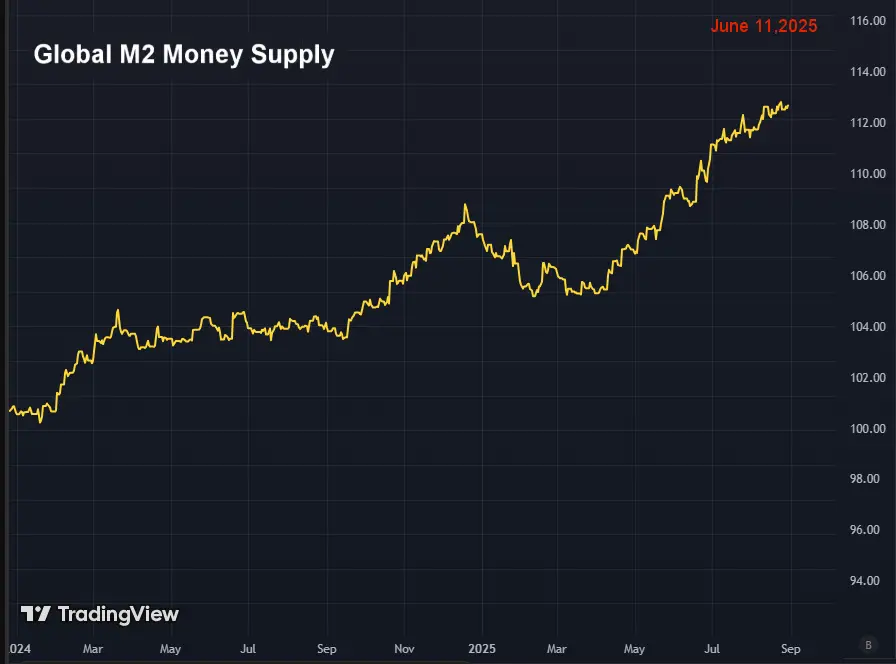
The Global M2 Money Supply is the composite of all the major countries’ money supplies. We can see that on a global scale, the money supply has been increasing throughout 2025. Generally, an increase in the money supply will result in a rising stock market with a 2 to 4-month delay. Starting at just over 100 in January 2024, it is now above 112, or a 12% increase in about 18 months.
 Federal Funds Rate:
The chart below shows the rapid increase in interest rates from February 2022, when they were just 0.08% to a year later, when they were at 4.57%. From August 2023 through August 2024, the FED maintained a stable Funds Rate at 5.33%. Then, in September, the FED announced a 1/2% reduction in the range. October numbers show the rate at 4.83%. At its November meeting, the Fed lowered the federal funds target range by 25 basis points to 4.5%-4.75%, with the actual rate coming in at 4.48% in December. On December 19, 2024, they lowered the target range to 4.25 – 4.50%, since then, the FED held its Funds rate steady from January through May 2025 at 4.33%. At the most recent FED meeting, Chairman Powell announced that the direction of inflation and Unemployment were still unclear, so the FED is holding rates steady.

Taking a longer-term view (below) gives a better picture. The common consensus seems to be that current rates are extremely high but, in this view, we can see that we are currently very close to the average rate since 1954, which is 4.6%.
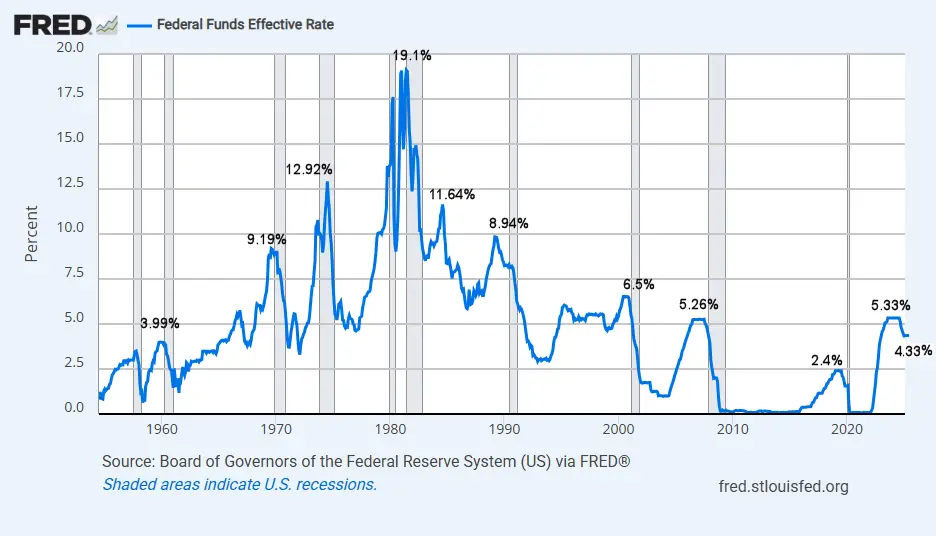 Data Source: Board of Governors of the Federal Reserve System (US)
History of Quantitative Easing
The market crash of 2008 destroyed liquidity and created massive deflationary forces, so the FED began fighting against deflation through traditional means and then through newly created Quantitative Easing. Then in November 2015, the FED switched sides and began slowly raising interest rates to fight against Inflation. From there, inflation rose from July 2016 through February 2017, convincing the FED that it was safe to raise rates more aggressively. On March 15, 2017, the Fed voted to raise its benchmark FED-funds rate by a quarter percentage point to a range of 0.75% to 1% on the assumption that inflation was building (and because they were desperate to raise rates so they would have somewhere to go in the next recession). At its June 2017 meeting, they decided to increase it by another quarter percentage point bringing the benchmark rate to a (1.0% to 1.25%) range. Those were their target ranges.
Throughout 2018 the FED followed a policy of Quantitative Tightening (QT) and raised the FED Funds rate that they charge banks. QT is the opposite of Quantitative Easing. In “Quantitative Easing” (QE), the FED acquires government debt by buying it on the open market. QT is a process whereby the FED reduces the debt held by not renewing Federal Debt when it matures.
According to the National Bureau of Economic Research (NBER), the U.S. entered a recession in February 2020 (shaded area) after the longest boom in economic history. According to NBER, the peak occurred in February 2020. Since unemployment was COVID-related rather than just a typical slowing economy, economic activity rose again rather quickly. In July 2021, NBER declared the bottom had occurred only a couple of months after the recession began. Thus giving us the shortest recession on record. But then we began feeling the consequences of all that money pumping.
See NYSE ROC for more info on how this may affect the stock market.
Quantitative Easing (and Inflation)
On November 25, 2008, the Federal Reserve announced that it would take the unprecedented step of purchasing up to $600 billion in agency mortgage-backed securities (MBS) and agency debt. This was the beginning of the Quantitative Easing program and later called QE1.
In December, the FED cut interest rates to near Zero.
In March 2009, the FED announced that it would purchase another $750 Billion in junk mortgages (Mortgage Backed Securities) and $300 Billion in Treasury Securities primarily because inflation was still heading down.
There is often a lag in the effects of money creation, but as QE1 ended, the inflation rate again began dropping, spending much of 2010 at just over 1%.
So the FED decides QE2 is necessary, and this time, it purchases another $600 Billion of Longer-Term Treasury Notes. The inflation rate increases to almost 4%, but when QE2 stops, the inflation rate begins falling again. Personally, I would love to see the inflation rate stay between 1 and 2% or, better yet, between 0% and 1%. In the long run, steady low inflation rates benefit everyone as people can accurately judge their future costs and make sound business decisions. But the government prefers a higher inflation rate so it can repay its massive debts with “cheaper dollars.” Inflation also erodes savings and causes consumers to act imprudently and spend more than they would if they had sound (unchanging) money. This is what the government means by “stimulating the economy”, i.e., causing people to spend more than they would prudently do otherwise. The apparent long-term effects are a society with more debt than it should have, and thus we see crashes as we saw in 2008. Then the government has to “do something,” so it prints more money to fix the problem it created by printing money in the first place. For more detail, see: Stimulate the Economy? Please Don’t!
On September 21, 2011, the Federal Open Market Committee announced Operation Twist which was designed to affect interest rates by the simultaneous buying of long-term bonds and selling short-term bonds.
On September 13, 2012, the FED announced QE3, which was $40 Billion a month in purchases, and on December 12, 2012, they announced an additional $45 Billion per month with no definite end in sight.
We’ve added QE1, through QE5, QT 1&2 to the chart so that you can see the effects on the inflation rate. These “Quantitative Easings” were not your typical FED money-printing schemes. In QE1, which lasted from November 25th, 2008 – to March 31, 2010, the FED started by purchasing $500 Billion in Mortgage-backed securities. Most of these securities were virtually worthless at this point. But a few months earlier, they were considered part of the larger money supply. So in effect, the FED bailed out the owners of this junk debt and pumped up the money supply simultaneously by converting worthless junk into “valuable” greenbacks.
In December, Ben Bernanke began “tapering,” which slowly shut off the flow of easy money, and by October 2014, the flow was stopped entirely.
In the video, What is the Real Purpose of the Federal Reserve? Edward Griffen reminds us that the Federal Reserve is just a bank cartel, and it primarily has its members’ interests at heart. So monetizing worthless junk paper and bailing out the banks that held them makes perfect sense when viewed in that light.

