Steampunk Inflation Calculator
(Be Patient remember this is Steampunk Technology
it takes a moment to build up steam! Watch the Fun! )
So it is not only a past inflation calculator but also a "future inflation calculator" as well. It calculates the inflation rate and inflation adjusted prices using conversion factors created by Oregon State University economists (page no longer updated).
For the period from 1913 - present, the data is based on the annual average U.S. Bureau of Labor Statistics CPI so it should produce roughly the same result as the BLS Inflation Calculator (see below) but it also combines other data sources for the periods outside the range available from the BLS. But it is only approximate since it takes the average index for the whole year. If you want accuracy down to a specific month you should use our Cumulative Inflation Calculator.
The Steam Punk Inflation Calculator tells you the cumulative inflation rate over the period chosen plus the inflation adjusted price of a starting value of your choice.
Simply enter the starting year, ending year and starting value and hit your enter key.
Remember this is a "SteamPunk" calculator so it takes a moment to build up enough steam to generate an answer. Please be patient and enjoy watching the lights flash and the gears spin.
You can click the "reset" button to try different numbers and watch the fun again.
A special thanks to Dana Mattocks for creating the amazing original SteamPunk Computer that this calculator was based upon and his generous creative commons license of the original photo.
BLS Inflation Calculator
The official U.S. Bureau of Labor Statistics Inflation calculator is based on the CPI data they calculate every month. It is a quick and easy way to calculate basic changes in purchasing power using average data by year but does not provide the cumulative inflation rate between two points or the accuracy down to a specific month. For greater accuracy or cumulative inflation use our Cumulative Inflation Calculator. [Read More...]
Inflation Adjusted Electricity Prices
Electricity Price Inflation Residential electricity prices in the U.S. have risen from an average of 7.83 cents per kilowatthour in 1990 to an average of 11.44 cents per kwh in 2010. This is a 46% increase in 20 years and sounds like a lot but as … [Read More...]
Misery Index
The original misery index was not created by Robert Barro as some people mistakenly believe. He created the “Barro Misery Index” (BMI) in 1999, which also includes interest rates and GDP trend into the mix. The standard original Misery index was … [Read More...]
Inflation Definitions
- Inflation is often defined as "an increase in the price you pay for goods" or a "decline in the
purchasing power of your money".
- Inflation causes - price inflation is often caused by an increase in the money supply thus decreasing the actual value of each individual unit of currency.
- Core Inflation is used primarily by academics to calculate the underlying inflation rate based on an increase in the money supply and is not terribly relevant to the average consumer because it doesn't include the volatile food and energy components. The opposite of core inflation is the "Walmart Inflation Index" designed by Charles Gave to include only Rent, Energy and Food since that is what the "working poor" who frequently shop at Walmart spend most of their income on.
- Deflation is generally considered to be "falling prices". But it has a variety of causes and can be either good or bad for an economy depending on its cause.
- Disinflation is a slowing or decrease in the rate of inflation. It is not to be confused with deflation which is actual falling prices. In disinflation prices are still rising simply not as fast as they once were.
- The term Agflation was coined in 2007 by Merrill Lynch analysts to describe the economic condition at the time whereby rising demand for agricultural products was driving up overall prices. The primary driver of agricultural prices was legislation requiring ethanol use in gasoline, thus increasing demand for corn.
- The term Stagflation was coined during the 1970's to describe the inflationary but stagnant economic conditions.
- Hyperinflation is typically associated with Weimar Germany but other well-known cases include Confederate Civil War Inflation and Zimbabwean Hyperinflation. Although there is no absolute pecentage where ordinary inflation turns into "hyperinflation" typically hyperinflation gets progressively worse until the economy implodes.
Cumulative Inflation Calculator
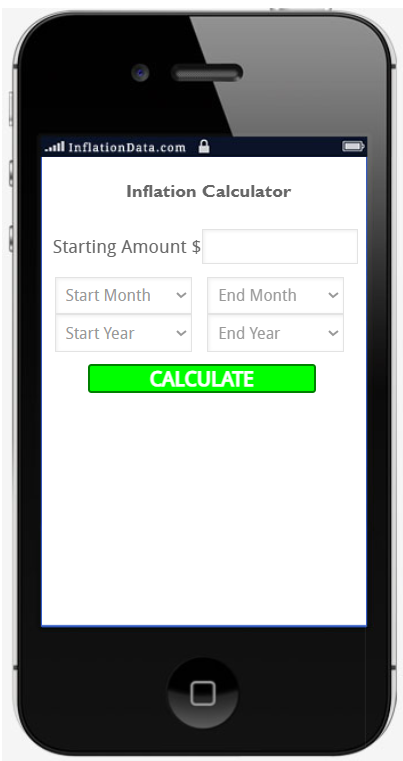
Switching from the archaic steampunk inflation calculator to the modern "Smartphone" design we have our updated Cumulative Inflation Calculator which allows you to calculate inflation by month and year rather than simply using a yearly average. The results provide a total cumulative inflation rate from the start date to the end date and an inflation adjusted price based on the starting value you provide.
Inflation calculations are based strictly on the U.S. Bureau of Labor statistics CPI data and are therefore limited to the dates from 1913 - Present.
U.K. Inflation Calculator (Pounds)
The U.K. Inflation Calculator works much like the official BLS inflation calculator in that it only calculates changes in price based on the average annual index and doesn't provide a cumulative inflation total.
The U.K. inflation calculator uses the U.K. Retail Prices Index and is capable of calculating inflation all the way back to 1751. It calculates a price comparison between different dates in Pounds, taking into consideration the U.K. inflation rate rather than the U.S. Dollar inflation rate.
So for instance, if something cost £100 in 1900 it would cost £11,000 in 2013. To use the Historical Price Converter simply enter a value and use the pull-down menus to choose a starting and ending date and the converter will tell you the value on the other date. [Read More...]
Cost of Living Calculator
The cost of maintaining a certain lifestyle varies from state to state and even from city to city within a state. Our cost of living calculator can help you compare the cost of living between two cities. It can also help you compare average salaries based on job title between two places.
Inflation Adjusted Prices
In order to get the true picture of the change in value of any commodity whether it be a stock, metal, agricultural product, energy or any other salable item, you need to adjust it for inflation.
We have created charts and tables of inflation adjusted prices for a variety of different commodities including:
Inflation Adjusted Crude Oil Prices (table) and Inflation Adjusted Oil Price Chart.
U.S. Treasury Inflation indexed bonds
Inflation Adjusted Gasoline Prices
Inflation Adjusted NYSE Stock Index
Inflation Adjusted College Education Costs
Inflation Indexed Natural Gas Prices
Inflation Adjusted Mortgage Rates
Inflation Adjusted Housing Prices
and even Inflation Adjusted Movie Box Office Revenues
Historical Gas Comparison Chart
The chart below shows the Nationwide average price of gasoline over the last year (12 months) compared to the gas price in Dallas and the price in Los Angeles. You can change the time period to see anywhere from 1 month to 6 years. Simply select the … [Read More...]
Cost of Gas- Current Gas Prices Nationwide
The following chart is updated throughout the day and shows the current average gas price by county based on prices reported by individuals around the country. You can zoom in and drag the map around to get a better look at your local gas prices. … [Read More...]