
Another Way to Measure Inflation is to compare one commodity to other commodities such as housing, the stock market, oil or gold. In the past we have compared Stock Market vs. Gold but today I’d like to compare the price of Oil vs. Gold.
Oil vs. Gold
Since gold is one of the oldest forms of money we can compare fiat prices with gold prices to get one measure of inflation. In the modern economy, oil is just as important, if not more important, than gold. Everything depends on oil, it heats our homes, runs our cars and machinery, and produces our electricity which in turn runs our computers, the internet, entertainment, lights, and HVAC. An argument could be made that our currency should actually be based on oil rather than gold. The only problem is portability… who wants to carry a barrel of oil to the grocery store? And a single ounce of gold will buy multiple barrels of oil.
Oil as a measure of inflation:
 Oil might also serve as a measure of inflation.
Today, I’d like to compare the price of gold with the price of oil. Theoretically, since both are commodities, if inflation were truly democratic, all prices would rise equally. Thus the ratio of the price of gold to the price of oil would remain constant. So then, as the value of the dollar depreciated (due to an increased supply of dollars) the price of both gold and oil would increase in tandem. This however has not happened. Both oil and gold are subject to external forces that have affected their price. So at times, each has been overpriced compared to the other.
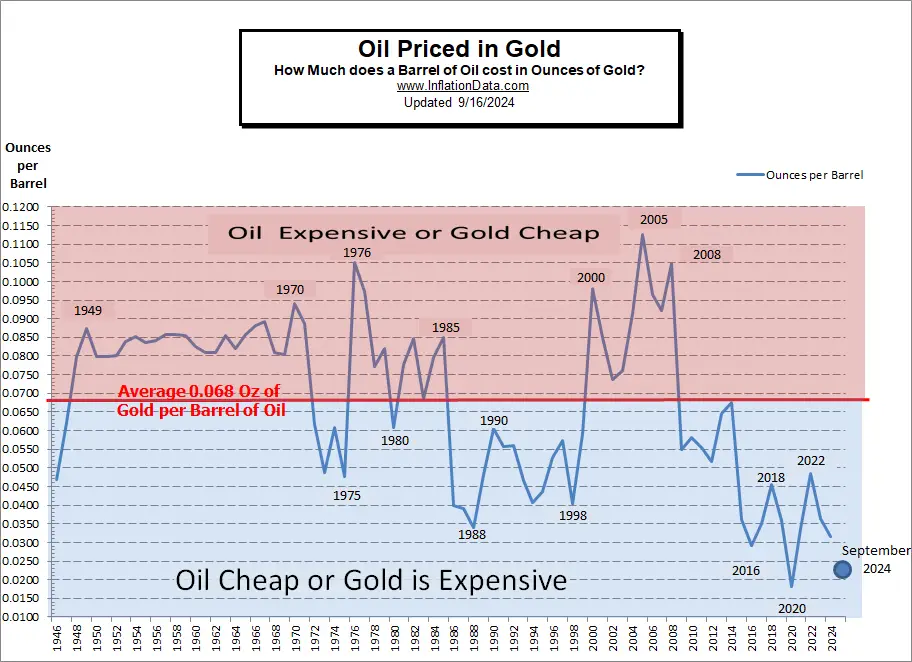
Traditionally economists have measured oil in terms of gold i.e. one barrel of oil is equal to some fraction of an ounce of gold (ounces per barrel of oil) which, if gold is actually money in disguise, it does make sense to say ounces per barrel, just as you’d say dollars per gallon.
 From the chart above, we can see that at the peak in 2005, when oil $50.04/bbl and gold was $444.74 per ounce oil was expensive compared to gold. Interestingly, by 2008 oil had increased in price to $91.48 (an 82.8% increase) but gold had increased to $871.96 (a 96% increase). So the ratio was fairly similar.
And by 2016, gold was $1,250.74 but oil had fallen to $36.34, so oil was cheap.
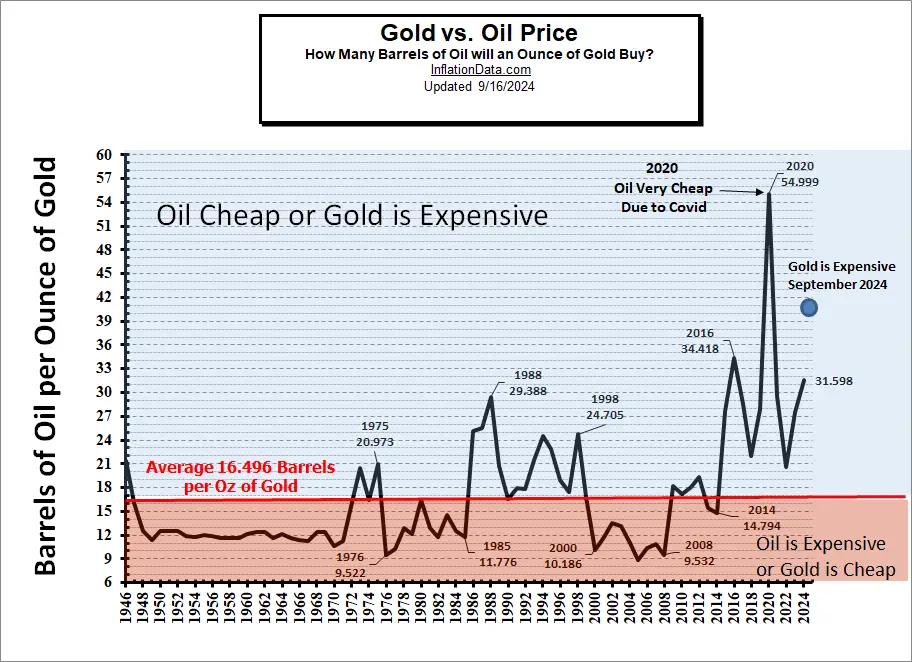
But I prefer dealing with whole numbers rather than fractions of an ounce, so I’ve created the following chart in terms of the number of barrels of oil a single ounce of gold will buy i.e. barrels per ounce.
For the period when Nixon set price controls on oil, we used the free market price of oil (called stripper because some “stripper” wells that were nearing their end of life were exempt from price controls.) We also used the free market price of gold rather than the government fixed price of $35 / ounce.
| Gold Prices source: Kitco
Oil Prices source: Plains-All-American |
Oil vs. Gold Chart Analysis
In looking at this chart we can see that the average since 1946 has been that one ounce of gold would buy 16.496 barrels of oil. Therefore, whenever one ounce of gold would buy more than 16.5 barrels of oil either oil was cheap or gold was expensive. And conversely, whenever an ounce of gold would buy less than 16.5 barrels, then oil was expensive or gold was cheap. As of this writing in September 2024 Gold is very expensive.
Click for larger Image
Knowing this we can decide when we should be buying gold and when we should be investing in oil instead. With the benefit of 20/20 hindsight we can see that from 1948 through 1970, oil was expensive and/or gold was cheap.
That makes sense because the price of gold was fixed and that is what eventually led to Nixon having to stop selling U.S. gold to foreign governments (i.e. closing the gold window) but also opening up gold sales to U.S. citizens. Once that pent up demand was released from 1970 to 1972 the price of gold shot up 62% while oil increased 6.2%. By 1973 oil was up over 40% but gold was up over 170%. Over 10 years (by 1980), oil was up over 1000% but gold was up over 1600%.
But what about that brief period from 1973 -1975 when gold was expensive compared to oil? Well from 1973 to 1974 oil prices were up almost 97% while gold prices were “only” up 58.13%. The following year oil prices actually fell. So from 1973 – 1975 oil was up 61+% and gold was up 65%. But then in 1976 gold fell and oil took off so that by 1978 oil was up 214.7% and gold was “only” up 98.6%. So once again when the ratio indicated that gold was overpriced oil performed better.
So if you had held gold from 1970 -1973, then switched to oil from 1974-1976 and back to gold for 1976-1980 instead of just being up 1600% you would have been up about 3600%!
Neither oil nor gold were good investments for the decade of the 1980s with gold losing -37.6% over the decade and oil losing -38%. From 1990 – 1999 oil lost another -28.6% and gold lost -27.3%. However by buying the cheap one and simultaneously selling the expensive one “short” you could still have made a tidy profit.
Note that in 1998, oil was cheap or gold was expensive and from 1999 -2000 oil was up 65.6% while gold was basically flat. In the early 2000’s gold was once again very cheap and it went from $271 in 2001 to $1669 in 2012 when oil was cheap again. Remember these are average annual prices, so you wouldn’t need to get the timing exactly right to hit them.
Where are We Now?
In 2019, Oil averaged $50.01 a barrel and gold averaged $1,514.75 so one ounce of gold would buy just over 30 barrels of oil (which is well above average). But in 2020, the ratio jumped to an astronomical 54.87 barrels per ounce of gold. This is more than 3 times normal. This tells us that either Gold was expensive or Oil was cheap (or both). In this case, probably both, due to COVID, there was an Oil glut, so oil was cheap. And since gold is a crisis hedge, due to the extreme fear levels… gold was in greater than normal demand.
In 2021, oil averaged $60.84 and gold averaged just under $1800. so one ounce of gold would buy 29.568 barrels of oil. Snd in September 2024 one ounce of gold will buy 40.7 barrels of oil.
A full list of prices and ratios is below.
| Annual Average Gold and Crude Price 1946-Present |
# of barrels of Oil 1 OZ Gold will buy |
Ounces per Barrel |
||
|---|---|---|---|---|
| Year | Average $/bbl |
Average $/oz |
Ave bbl / oz | Ave oz / bbl |
| 1946 | $1.63 | $34.71 | 21.294 | 0.0470 |
| 1947 | $2.16 | $34.71 | 16.069 | 0.0622 |
| 1948 | $2.77 | $34.71 | 12.531 | 0.0798 |
| 1949 | $2.77 | $31.69 | 11.440 | 0.0874 |
| 1950 | $2.77 | $34.72 | 12.534 | 0.0798 |
| 1951 | $2.77 | $34.72 | 12.534 | 0.0798 |
| 1952 | $2.77 | $34.60 | 12.491 | 0.0801 |
| 1953 | $2.92 | $34.84 | 11.932 | 0.0838 |
| 1954 | $2.99 | $35.04 | 11.719 | 0.0853 |
| 1955 | $2.93 | $35.03 | 11.956 | 0.0836 |
| 1956 | $2.94 | $34.99 | 11.901 | 0.0840 |
| 1957 | $3.00 | $34.95 | 11.650 | 0.0858 |
| 1958 | $3.01 | $35.10 | 11.661 | 0.0858 |
| 1959 | $3.00 | $35.10 | 11.700 | 0.0855 |
| 1960 | $2.91 | $35.27 | 12.120 | 0.0825 |
| 1961 | $2.85 | $35.25 | 12.368 | 0.0809 |
| 1962 | $2.85 | $35.23 | 12.361 | 0.0809 |
| 1963 | $3.00 | $35.09 | 11.697 | 0.0855 |
| 1964 | $2.88 | $35.10 | 12.188 | 0.0821 |
| 1965 | $3.01 | $35.12 | 11.668 | 0.0857 |
| 1966 | $3.10 | $35.13 | 11.332 | 0.0882 |
| 1967 | $3.12 | $34.95 | 11.202 | 0.0893 |
| 1968 | $3.18 | $39.31 | 12.362 | 0.0809 |
| 1969 | $3.32 | $41.28 | 12.434 | 0.0804 |
| 1970 | $3.39 | $36.02 | 10.625 | 0.0941 |
| 1971 | $3.60 | $40.62 | 11.283 | 0.0886 |
| 1972 | $3.60 | $58.42 | 16.228 | 0.0616 |
| 1973 | $4.75 | $97.39 | 20.503 | 0.0488 |
| 1974 | $9.35 | $154.00 | 16.471 | 0.0607 |
| 1975 | $7.67 | $160.86 | 20.973 | 0.0477 |
| 1976 | $13.10 | $124.74 | 9.522 | 0.1050 |
| 1977 | $14.40 | $147.84 | 10.267 | 0.0974 |
| 1978 | $14.95 | $193.40 | 12.936 | 0.0773 |
| 1979 | $25.10 | $306.00 | 12.191 | 0.0820 |
| 1980 | $37.42 | $615.00 | 16.435 | 0.0608 |
| 1981 | $35.75 | $460.00 | 12.867 | 0.0777 |
| 1982 | $31.83 | $376.00 | 11.813 | 0.0847 |
| 1983 | $29.08 | $424.00 | 14.580 | 0.0686 |
| 1984 | $28.75 | $361.00 | 12.557 | 0.0796 |
| 1985 | $26.92 | $317.00 | 11.776 | 0.0849 |
| 1986 | $14.64 | $368.00 | 25.137 | 0.0398 |
| 1987 | $17.50 | $447.00 | 25.543 | 0.0391 |
| 1988 | $14.87 | $437.00 | 29.388 | 0.0340 |
| 1989 | $18.33 | $381.00 | 20.786 | 0.0481 |
| 1990 | $23.19 | $383.51 | 16.538 | 0.0605 |
| 1991 | $20.19 | $362.11 | 17.935 | 0.0558 |
| 1992 | $19.25 | $343.82 | 17.861 | 0.0560 |
| 1993 | $16.74 | $359.77 | 21.492 | 0.0465 |
| 1994 | $15.66 | $384.00 | 24.521 | 0.0408 |
| 1995 | $16.75 | $383.79 | 22.913 | 0.0436 |
| 1996 | $20.46 | $387.81 | 18.955 | 0.0528 |
| 1997 | $18.97 | $331.02 | 17.450 | 0.0573 |
| 1998 | $11.91 | $294.24 | 24.705 | 0.0405 |
| 1999 | $16.55 | $278.98 | 16.857 | 0.0593 |
| 2000 | $27.40 | $279.11 | 10.186 | 0.0982 |
| 2001 | $23.00 | $271.04 | 11.784 | 0.0849 |
| 2002 | $22.81 | $309.73 | 13.579 | 0.0736 |
| 2003 | $27.69 | $363.38 | 13.123 | 0.0762 |
| 2004 | $37.41 | $409.72 | 10.952 | 0.0913 |
| 2005 | $50.04 | $444.74 | 8.888 | 0.1125 |
| 2006 | $58.30 | $603.46 | 10.351 | 0.0966 |
| 2007 | $64.20 | $695.39 | 10.832 | 0.0923 |
| 2008 | $91.48 | $871.96 | 9.532 | 0.1049 |
| 2009 | $53.48 | $972.35 | 18.180 | 0.0550 |
| 2010 | $71.21 | $1,224.53 | 17.196 | 0.0582 |
| 2011 | $87.04 | $1,571.52 | 18.055 | 0.0554 |
| 2012 | $86.46 | $1,668.98 | 19.303 | 0.0518 |
| 2013 | $91.17 | $1,411.23 | 15.479 | 0.0646 |
| 2014 | $85.60 | $1,266.40 | 14.794 | 0.0676 |
| 2015 | $41.85 | $1,160.06 | 27.719 | 0.0361 |
| 2016 | $36.34 | $1,250.74 | 34.418 | 0.0291 |
| 2017 | $43.97 | $1,257.12 | 28.590 | 0.0350 |
| 2018 | $57.77 | $1,268.49 | 21.958 | 0.0455 |
| 2019 | $50.01 | $1,514.75 | 30.289 | 0.0330 |
| 2020 | $32.25 | $1,769.64 | 54.873 | 0.0182 |
| 2021 | $60.84 | $1,798.89 | 29.568 | 0.0338 |
| 2022 | $87.40 | $1,801.87 | 20.616 | 0.048505 |
| 2023 | $70.60 | $1,943.00 | 27.521 | 0.036336 |
| 2024
(partial year) |
$72.00 | $2,275.09 | 31.598 | 0.31647 |
| Average | 16.496 | 0.0680 | ||
You might also like:
- Another Way to Measure Inflation
- Stock Market vs. Gold
- Inflation-Adjusted Annual Average Gold Prices
- Is It Time to Admit That Gold Peaked in 2011?
- How the Dollar Affects Gold Prices

This is the game where should I have to go for gold or for oil ..which one is more important sir Putin says let’s think about it
I wish you’d update this for 2020! My dad would explain this to me in the 80s, but I cant wrap me head around what’s happening. Hyperinflation of gold, deflation of oil?
Done!
Hello TIM
Not sure if you still write about oil and gold vs each other or vs dollar. We sure are in very different times with oil close to 20 a bar/gold near 1600.
Is there more updated news you have written lately.
Thanks, Larry
Yep, its been updated.