• Home
  • Related Sites
    • Financial Trend Forecaster
      • Moore Inflation Predictor
      • NYSE Rate of Change (ROC)
      • NASDAQ Rate of Change (ROC)
      • Crypto ROC- BTC & ETH
    • Unemployment Data
      • Historical Employment Data
      • Unemployment Rate Chart
      • Labor Force Participation Rate
    • Optio Money
    • Elliott Wave University
    • More Resources
  • Definitions
    • What is Inflation?
    • What is Core Inflation?
    • Inflation vs CPI
    • What is Deflation?
    • What is Disinflation?
    • What is Agflation?
    • What is Stagflation?
    • What is Hyperinflation?
    • What is Quantitative Easing?
    • What is Quantitative Tightening?
    • What is Velocity of Money?
    • What is Fiat Currency?
    • How Do I Calculate Inflation?
    • What are “Sticky Prices” and Why Do They Matter?
  • Featured Content
  • About Us
  • Feedback
    • Sitemap
  • Subscribe Now

InflationData.com

Your Place in Cyber Space for Inflation Data

CPI Data for July 2026
  • Numerical Inflation Data
    • Current Inflation Rate
    • Monthly Inflation Rate (Moved)
    • Historical U.S. Inflation Rates
    • Historical CPI
  • Inflation Charts
    • Ann. Inf. Rate Chart
    • Long Term Inflation >
      • Ave. Inf. by Decade
      • Total Inf. by Decade
      • Inflation 1913-1919
      • Inflation 1920-1929
      • Inflation 1930-1939
      • Inflation 1940-1949
      • Inflation 1950-1959
      • Inflation 1960-1969
      • Inflation 1970-1979
    • Cumulative Inflation
    • FED Monetary Policy and Inflation
    • Core Inflation, Trimmed Mean and Personal Consumption Expenditures
    • Inflation and Recession
    • Confederate Inflation (1861 – 1865)
    • Misery Index
    • The 3 Stages of Inflation
    • 15-Yr Inflation Trends Chart
  • Inflation Calculators
    • Cumulative Inf. Calc.
    • How Much Would it Cost
    • Historical Inflation Calculator since 1774
    • Salary Inf. Calc.
    • U.K. Inf. Calc.
    • Cost of Gas Calc.
    • Net Worth Calc.
    • Lifetime Earnings Calc.
    • Savings Goal Calc.
    • Financial Calculators
  • Inf. Adjusted Prices
    • Energy >
      • Inflation Adj. Gas Prices
      • Historical Oil Prices Chart
      • Crude Oil Price (Table)
      • Natural Gas Prices
      • Electricity Prices
      • Oil vs Gold
    • Gold >
      • Inflation Adjusted Annual Average Gold Prices
      • Gold is a “Crisis Hedge” not an  “Inflation Hedge”
      • Comparing Oil vs. Gold
    • Corn Prices
    • Education Inflation
    • Housing Prices
    • Mortgage Rates
    • NYSE Index
    • Inf. Indexed Bonds
    • Movie Revenues
    • Inflation-Adjusted Wages
  • Cost of Living
    • Calculate Cost of Living
    • Cost-of-living Adj. (COLA)
    • Consumer Price Index CPI
      • Historical CPI
      • Current CPI
      • CPI Release Dates
    • Gas Prices >
      • Cost of Gas
      • Cost of Gas Per Month
      • Gas vs. Oil Price Chart
    • Food Prices 1913 vs 2013
    • Health Insurance
  • Blog
    • Key Inflation Articles
    • International Inflation
    • Historical Inflation Rates for Japan (1971 to 2014)
You are here: Home » Moore Inflation Predictor

September Annual Inflation Down to 2.28%

Published on October 12, 2018 by Tim McMahon Leave a Comment

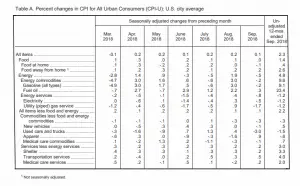
September BLS Table

The U.S. Bureau of Labor Statistics (BLS) released their monthly Consumer Price Index report on October 11th 2018, for the 12 month period through the end of September. Annual Inflation is Down  Annual inflation was down from 2.70% in August and 2.95% in July to 2.28% in September. CPI was 252.439 in September, 252.146 in August, 252.006 in July and 251.989 in June. Monthly Inflation for September was 0.12%, August was 0.06%, July was 0.01%, and June was 0.16% compared to 0.53% in September 2017. Next release November 14th Monthly Inflation: Annual inflation for the 12 months ending in September was 2.28% down from 2.70% in August. "The Consumer Price Index for All … [Read more...]

Filed Under: Uncategorized Tagged With: annual inflation, BLS, CPI, Food and Energy, inflation, Misery Index, Moore Inflation Predictor, NASDAQ, NASDAQ Rate of Change, NYSE, NYSE Rate of Change, ROC, September

August Inflation Down

Published on September 14, 2018 by Tim McMahon Leave a Comment

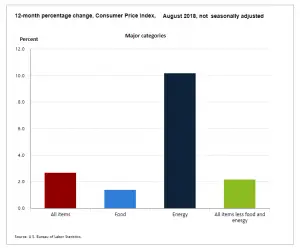
August Food and Energy inflation Breakdown

On September 13th 2018, the U.S. Bureau of Labor Statistics released their monthly Consumer Price Index report on the status of Inflation for the 12 months through the end of August. Annual Inflation is Down Annual inflation in August was 2.70% down from 2.95% in July and 2.87% in June. (BLS rounds both to 2.9%) CPI was 252.146 in August, 252.006 in July and 251.989 in June. Monthly Inflation for August was 0.06%, July was 0.01%, and June was 0.16% compared to 0.30% in August 2017. Next release October 11th Monthly Inflation: Annual inflation for the 12 months ending in August was 2.70%.  2.95% up from 2.87% in June. The U.S. Bureau of Labor Statistics (BLS) rounds … [Read more...]

Filed Under: BLS Tagged With: BLS, CPI, CPI-U, inflation, MIP, Misery Index, Moore Inflation Predictor, NASDAQ, NYSE, ROC

January’s Monthly Inflation 0.54%

Published on February 15, 2018 Updated on March 31, 2021 by Tim McMahon 2 Comments

The U.S. Bureau of Labor Statistics released the Annual Inflation Rate data for the year through the end of January on February 14th 2018. Annual inflation was 2.07% in January down from 2.11% in December CPI-U up from 246.524 to 247.867 Monthly Inflation for January 0.54% compared to 0.57% in January 2017 Next release March 13th   Monthly Inflation is High, But... Typically the monthly inflation rate is highest during the first quarter (January through March) and lowest during the last quarter (October through December). January 2017 had inflation of 0.57% and so January 2018's 0.54% is right in line with that (resulting in annual inflation of 2.07%). However if … [Read more...]

Filed Under: BLS Tagged With: inflation, Misery Index, Moore Inflation Predictor, quantitative easing, Quora, ROC

Recent Posts

  • July 2026 Inflation Down
  • Core Inflation, Trimmed Mean and Personal Consumption Expenditures
  • June Inflation Down Sharply
  • How Explosive Growth in AI Triggers Inflation
  • Warsh’s First FOMC: No Dot, No Guidance, and No Dovish Pivot

Subscribe Now

eTrends Signup Form

A Message from Our Editor

Eliminate Debt

Post Archives

Sponsored:

As a Seasoned Investor I thought I'd seen everything... But recently I discovered TradingView which has really improved the information I have at my fingertips.~ Tim McMahon, editor

TradingView gives me an edge... including powerful charting tools, real-time market data, and a global community of traders—all in one easy to use platform. It has hundreds of indicators, and even custom scripts for more advanced users, and you don't need to change Brokers just use its seamless brokerage integration... TradingView isn't just a charting tool—it's your full trading command center.

Trade smarter. Trade faster. Check Out TradingView for free.

----------

The Best Place to Buy Your Crypto

Coinbase is the largest Crypto Trading platform in the U.S. and the easiest to use. ~Tim McMahon, editor

Check out Coinbase here

Home | Articles | Sitemap | Terms of Service | Privacy | Disclaimer | Advertise With Us

Copyright © 1996-2026 · Capital Professional Services, LLC · Maintained by Design Synergy Studio · Admin

Do Not Sell My Personal Information