• Home
  • Related Sites
    • Financial Trend Forecaster
      • Moore Inflation Predictor
      • NYSE Rate of Change (ROC)
      • NASDAQ Rate of Change (ROC)
      • Crypto ROC- BTC & ETH
    • Unemployment Data
      • Historical Employment Data
      • Unemployment Rate Chart
      • Labor Force Participation Rate
    • Optio Money
    • Elliott Wave University
    • More Resources
  • Definitions
    • What is Inflation?
    • What is Core Inflation?
    • Inflation vs CPI
    • What is Deflation?
    • What is Disinflation?
    • What is Agflation?
    • What is Stagflation?
    • What is Hyperinflation?
    • What is Quantitative Easing?
    • What is Quantitative Tightening?
    • What is Velocity of Money?
    • What is Fiat Currency?
    • How Do I Calculate Inflation?
    • What are “Sticky Prices” and Why Do They Matter?
  • Featured Content
  • About Us
  • Feedback
    • Sitemap
  • Subscribe Now

InflationData.com

Your Place in Cyber Space for Inflation Data

CPIWidget-Jan26
  • Numerical Inflation Data
    • Current Inflation Rate
    • Monthly Inflation Rate (Moved)
    • Historical U.S. Inflation Rates
    • Historical CPI
  • Inflation Charts
    • Ann. Inf. Rate Chart
    • Long Term Inflation >
      • Ave. Inf. by Decade
      • Total Inf. by Decade
      • Inflation 1913-1919
      • Inflation 1920-1929
      • Inflation 1930-1939
      • Inflation 1940-1949
      • Inflation 1950-1959
      • Inflation 1960-1969
      • Inflation 1970-1979
    • Cumulative Inflation
    • FED Monetary Policy and Inflation
    • Inflation and Recession
    • Confederate Inflation (1861 – 1865)
    • Misery Index
    • The 3 Stages of Inflation
    • 15-Yr Inflation Trends Chart
  • Inflation Calculators
    • Cumulative Inf. Calc.
    • How Much Would it Cost
    • Salary Inf. Calc.
    • Cost of Living Calc.
    • U.K. Inf. Calc.
    • Cost of Gas Calc.
    • Net Worth Calc.
    • Lifetime Earnings Calc.
    • Savings Goal Calc.
    • Financial Calculators
  • Inf. Adjusted Prices
    • Energy >
      • Inflation Adj. Gas Prices
      • Historical Oil Prices Chart
      • Crude Oil Price (Table)
      • Natural Gas Prices
      • Electricity Prices
      • Oil vs Gold
    • Gold >
      • Inflation Adjusted Annual Average Gold Prices
      • Gold is a “Crisis Hedge” not an  “Inflation Hedge”
      • Comparing Oil vs. Gold
    • Corn Prices
    • Education Inflation
    • Housing Prices
    • Mortgage Rates
    • NYSE Index
    • Inf. Indexed Bonds
    • Movie Revenues
    • Inflation-Adjusted Wages
  • Cost of Living
    • Calculate Cost of Living
    • Cost-of-living Adj. (COLA)
    • Consumer Price Index CPI
      • Historical CPI
      • Current CPI
      • CPI Release Dates
    • Gas Prices >
      • Cost of Gas
      • Cost of Gas Per Month
      • Gas vs. Oil Price Chart
    • Food Prices 1913 vs 2013
    • Health Insurance
  • Blog
    • Key Inflation Articles
    • International Inflation
    • Historical Inflation Rates for Japan (1971 to 2014)
You are here: Home » Blog » Government » The Federal Reserve » Are Deflationary Forces Taking Hold Again?

Are Deflationary Forces Taking Hold Again?

Published on January 17, 2019 by Elliott Wave International Leave a Comment

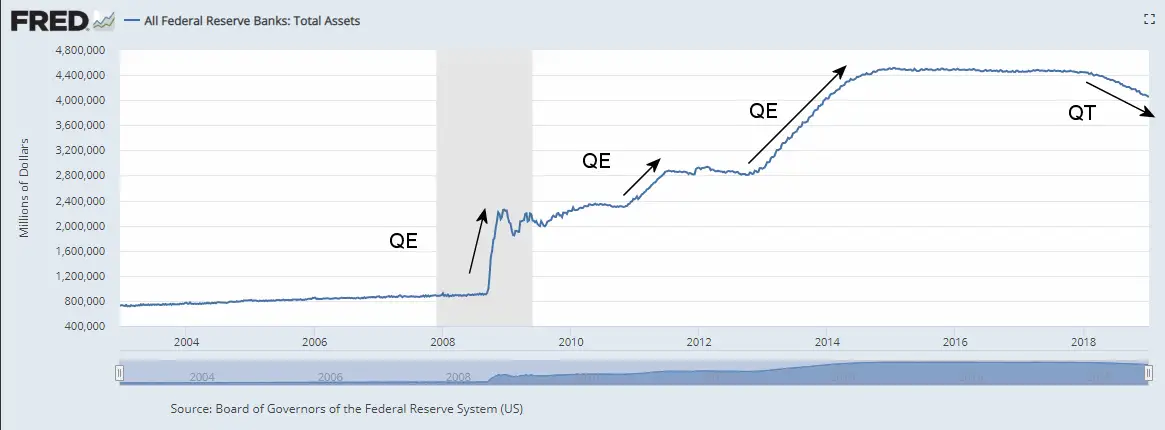
From the chart below we can see that deflation was an issue in 2009 as the market eliminated billions of dollars in assets when it crashed. The FED used all the tricks in the book to combat the contraction of the money supply including lowering interest rates to near zero and when that wasn’t enough it began buying assets through its “quantitative easing” (QE) programs. But the deflationary forces weren’t through yet and by 2015 the FED was once again battling deflation.

In the chart below we can see that after dropping interest rates to almost zero they kept them there until 2016 when they increased rates very tentatively. But in 2017 they began raising rates a bit more aggressively.

Rising Interest Rates
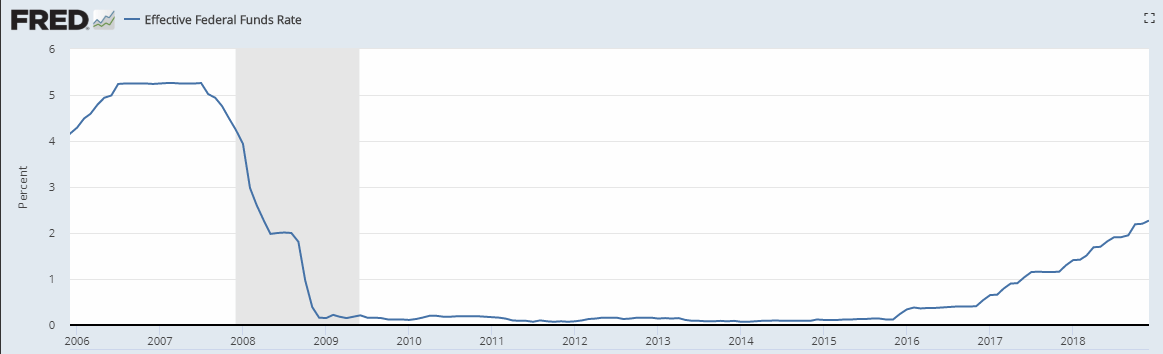
We can also see the various Quantitative Easing (QE) programs but once Quantitative Tightening (QT) began it didn’t take long before the inflation rate took a nosedive. Typically, FED actions take 12 to 18 months before they show up in the economy at large but this time we saw inflation beginning to fall after only about 6 months.

Quantitative Tightening
In the following article by Murray Gunn of Elliott Wave International he looks at some of the more technical aspects of the FED equation and other indicators that deflationary forces might be taking control once again.  ~Tim McMahon, editor


There is evidence that deflationary forces are already taking hold in America

By Murray Gunn

When I was writing technical analysis reports for the customers of a major global bank, I received some interesting feedback from one of the bank’s relationship managers. The customers liked the reports, she said, but it would be good if I made them less “technical.” Making technical analysis reports less technical, hmmm. (To be fair, it is actually good advice because striking a balance between technical details and readability is an art.) Sometimes, though, an explanation of a concept cannot help but delve into some detail. So please bear with me on this one.

Evidence is emerging that banks in the U.S. are struggling to find the money required to fund their operations. The “Fed Funds Rate” that gets the headlines when it is changed by the Open Market Committee of the Federal Reserve is not the whole story when we are looking at the technicalities of the money market. That rate is actually the Fed Funds Target Rate (Upper Bound). You see, the Fed sets an interest rate range, currently between 2% and 2.25%. Every day, banks in America lend and borrow the reserves they hold at the Fed at a rate which fluctuates in between that range. That rate is called the Fed Funds Effective rate. If there is increasing demand for money from banks, the Effective Fed Funds rate will drift higher. Contrary to popular belief, therefore, the Fed does not control the Fed Funds rate.

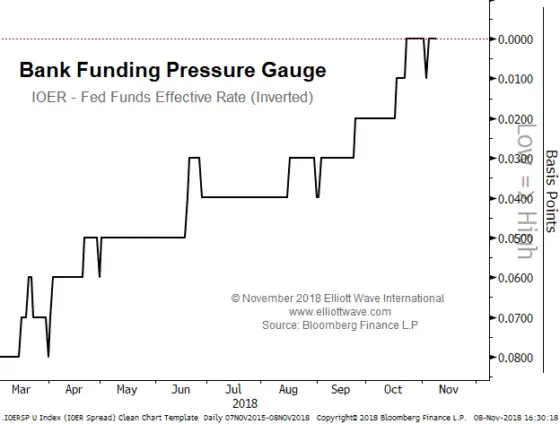
But wait, there’s yet another interest rate to consider. The Fed uses a rate called the Interest on Excess Reserves (IOER) as a tool to manipulate (sorry, influence) how close the Effective Fed Funds rate comes to the Target Rate (Upper Bound). If the Fed thinks that the Effective Rate is drifting too high, it will lower the IOER to encourage the Effective Rate back down (if the Effective Rate was above the IOER, banks would remove their excess reserves from the Fed to make more money by lending at the higher rate). I do hope you are still with me!

The Fed Funds Effective rate has been steadily rising in the range this year. In June, the Fed raised its Target Rate by 25 basis points but only raised the IOER by 20 basis points, a sign that it was concerned about the rising Effective Rate. However, the Fed Funds Effective rate has continued to rise. The chart below shows that the Effective Rate is now the same as the IOER and this indicates that there is still increasing demand for funds from banks.

The question is, why?

There are a number of explanations but one getting attention at the moment is whether banks are, essentially, running out of money. Since the Fed started taking away the liquidity punchbowl via its policy of Quantitative Tightening (QT) there has been increasing pressure on bank reserves, especially given that a lot of those reserves now have to be allocated to comply with new regulations. The relentless squeeze higher in the Fed Funds Effective rate could be a signal that banks are scrambling for funds.

The Fed itself does not buy that theory but, if there is an element of truth to it, here’s the stunning conclusion. If banks are already scrambling for funding after QT has barely begun, imagine what it is going to look like in the future as the Fed seems hell-bent on continuing to reduce the size of its balance sheet. There may be a dawning realization that when you scratch the surface of the liquidity mask that the Fed created by Quantitative Easing, what lies beneath is still very ugly.

Murray Gunn has worked for several firms as a fund manager in global bonds, currencies and stocks, including long posts at Standard Life Investments, the Abu Dhabi Investment Authority and HSBC Bank as Head of Technical Analysis. He has served on the board of the Society of Technical Analysts (UK) and is editor of Elliott Wave International’s European Financial Forecast Short Term Update.


This article was syndicated by Elliott Wave International and was originally published under the headline Deflation Alert: Money Already Scarce. EWI is the world’s largest market forecasting firm. Its staff of full-time analysts led by Chartered Market Technician Robert Prechter provides 24-hour-a-day market analysis to institutional and private investors around the world.

You might also like:

  •  Gold as an Investment
  •  2018 Ends with More Disinflation
  •  How Inflation and Interest Rates Relate
  •  Why Inflation Matters to Small Businesses
  •  November was Deflationary

Filed Under: The Federal Reserve Tagged With: FED, Federal Reserve

Leave a Reply Cancel reply

Your email address will not be published. Required fields are marked *

This site uses Akismet to reduce spam. Learn how your comment data is processed.

Latest Posts

  • Updated Cumulative Inflation Calculator
  • Inflation-Adjusted Silver Prices
  • December Inflation Down Slightly, Not Flat
  • December 2025 Inflation Report for November
  • How Deflation Created the Middle Class
  • October Inflation Numbers Delayed
  • Why the 2.8% COLA May Fall Short of Real Inflation
  • Delayed BLS September Inflation Data Released

Sponsored:

As a Seasoned Investor I thought I'd seen everything... But recently I discovered TradingView which has really improved the information I have at my fingertips.~ Tim McMahon, editor

TradingView gives me an edge... including powerful charting tools, real-time market data, and a global community of traders—all in one easy to use platform. It has hundreds of indicators, and even custom scripts for more advanced users, and you don't need to change Brokers just use its seamless brokerage integration... TradingView isn't just a charting tool—it's your full trading command center.

Trade smarter. Trade faster. Check Out TradingView for free.

----------

The Best Place to Buy Your Crypto

Coinbase is the largest Crypto Trading platform in the U.S. and the easiest to use. ~Tim McMahon, editor

Check out Coinbase here

Subscribe Now

eTrends Signup Form

Elliott Wave Resources

Free Elliott Wave Resources

What is Waveopedia?

Waveopedia is EWI’s free, comprehensive index of Elliott wave patterns and terms. Everyone from beginners to experts can benefit from it. It’s a great place to send your followers if they’re new to Elliott waves.

  • Deflation Hits China is the U.S. Next?

  • Why You Must Avoid the Herding Trap

  • Chasing Trends Can Cost You

  • More Education Resources

Post Archives

Home | Articles | Sitemap | Terms of Service | Privacy | Disclaimer | Advertise With Us

Copyright © 1996-2026 · Capital Professional Services, LLC · Maintained by Design Synergy Studio · Admin

Do Not Sell My Personal Information