
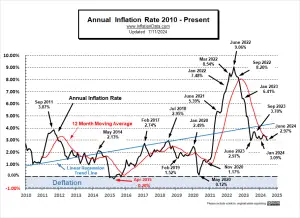
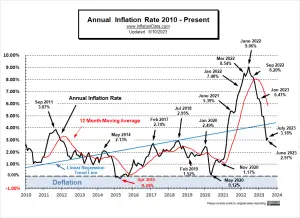
The U.S. Bureau of Labor Statistics released its June Inflation report on July 11th showing Annual Inflation was down from 3.3% in May to 3% in June. (But since we calculate it to two digits, it was actually 3.27% in May and 2.97% in June.) On a non-seasonally adjusted basis, monthly inflation in June was 0.03%. The Cleveland FED had been predicting that the inflation rate would come in at 3.12% so inflation was considerably lower than expectations. Markets took this as a good sign hoping for rate cuts possibly in September and rallied. The biggest beneficiaries were small cap stocks which have been beaten down by higher interest rates. The FED has been hinting that they would … [Read more...]
April Inflation Sparks Market

The U.S. Bureau of Labor Statistics released its April Inflation report on May 15th showing Annual Inflation was down from 3.5% in March to 3.4% in April. (but since we calculate it to two digits, it was actually 3.48% in March and 3.36% in April.) The markets took this as a good sign and the NYSE rallied 157.68 points resulting in a 0.87% gain. The NASDAQ did even better gaining 231.21 points or 1.40%. Prior to the gain, our NASDAQ ROC was flashing a warning signal. But we did say that we needed to wait for confirmation before selling. Unadjusted monthly inflation was 0.65% in March which moderated sharply to "only" 0.39% in April. Typically inflation is highest in the first … [Read more...]
March Inflation Causes Market Concern

The U.S. Bureau of Labor Statistics CPI report released on April 10th, showed Annual Inflation was up from 3.2% in February to 3.5% in March. (but since we calculate it to two digits, it was actually 3.15% in February and 3.48% in March.) Monthly inflation was 0.62% in February and 0.65% in March. Typically inflation is highest in the first quarter of the year, so these numbers are a bit high but not that unusual. In March 2023 monthly inflation was 0.33%, so annual inflation jumped in 2024. Mr. Market didn't like the news because it drastically reduced the chances of a rate cut anytime soon. So, stocks fell on the release. The NYSE opened at 18,171.20 and that was the high for the … [Read more...]
February 2024 Inflation Up Slightly

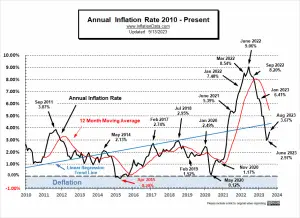
According to the Bureau of Labor Statistics CPI report released on March 12th, Annual Inflation was up from 3.1% in January 3.2% in December. (but since we calculate it to two digits, it was actually 3.09% in January and 3.15% in February.) Monthly inflation was 0.54% in January and 0.62% in February. Typically inflation is highest in the first quarter of the year, so these numbers are not that unusual. In January 2023 monthly inflation was 0.80%, so annual inflation was lower in 2024 but monthly inflation was "only" 0.56% in February 2023 so annual inflation increased in 2024. The BLS's Seasonally Adjusted Monthly rate for January was 0.3%, and 0.4% in February. As you can see … [Read more...]
January 2024 Annual Inflation Down Despite High Monthly Inflation
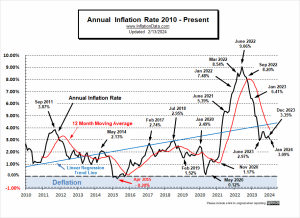
According to the Bureau of Labor Statistics CPI report released on February 13th, Annual Inflation was down to 3.1% in January from 3.4% in December. (but since we calculate it to two digits, it was actually 3.09% in January and 3.35% in December.) Monthly inflation was -0.10% in December and 0.54% in January. But since inflation is highest in the first quarter of the year, these numbers are not unusual. But in January 2023 monthly inflation was 0.80%, so annual inflation is lower in 2024. The BLS's Seasonally adjusted monthly rate for January was 0.30%, the same as December 2023. As you can see from our MIP projection from last month, inflation was at the high end of our range. … [Read more...]
December Inflation Increases to 3.35%
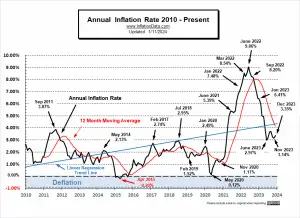
According to the Bureau of Labor Statistics CPI report released on January 11th, Annual Inflation was up to 3.4% in December from 3.1% in November. (but since we calculate it to two digits, it was actually 3.35%.) Monthly inflation was -0.04% in October, -0.20% in November, and -0.10% in December, But inflation is almost always low to negative in the fourth quarter of the year, so these numbers are not unusual. The BLS's Seasonally adjusted monthly rate for December was actually a positive 0.30% indicating that even though unadjusted was negative, it was not as negative as usual (making the adjusted numbers higher). The stock market was expecting another decline in inflation like … [Read more...]
August 2023 Inflation Up Sharply
According to the Bureau of Labor Statistics CPI report released on September 13th, Annual Inflation increased from 3.2% in July to 3.7% in August. (but more precisely, it was from 3.18% to 3.67%.) Monthly inflation went from 0.19% in July to 0.44% in August. August 2023 Inflation Summary: Annual Inflation rose from 3.18% to 3.67% CPI Index rose from 305.691 to 307.026 Monthly Inflation for August was 0.44%, July was 0.19% and June was 0.32%. Next release October … [Read more...]
July Annual Inflation- Up Slightly
According to the Bureau of Labor Statistics CPI report released on August 10th, Annual Inflation increased from 3% in June to 3.2% in July. (but more precisely, it was from 2.97% to 3.18%.) Monthly inflation was 0.25% for May 2023, 0.32% in June, and 0.19% in July. July 2023 Inflation Summary: Annual Inflation rose from 2.97% to 3.18% CPI Index rose from 305.109 to 305.691 Monthly Inflation for July was 0.19%, down from 0.32% in June Next release is September … [Read more...]
May Inflation Falls to 4%
According to the Bureau of Labor Statistics CPI report released on June 13th, Annual Inflation declined from 4.9% in April to 4.0% in May. (but according to our calculations, it was from 4.93% to 4.05%.) Monthly inflation was 0.25% for May 2023, compared to 1.10% in May 2022. May 2023 Inflation Summary: Annual Inflation fell from 4.93% to 4.05% CPI Index rose from 303.363 to 304.127 Monthly Inflation for April was 0.25% Next release July … [Read more...]
Inflation Less Than Experts Predict in March
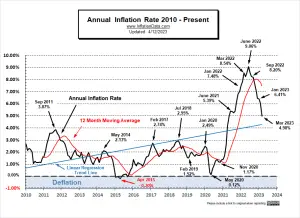
Annual inflation PLUNGED in March according to the Bureau of Labor Statistics CPI report released on April 12th. Monthly inflation was 0.33% for March 2023, compared to 1.34% in March 2022. This resulted in a 1% drop in Annual inflation. But despite the significant drop in inflation, the stock market did not rally. Instead, the NYSE lost a few points, and the NASDAQ lost just over 100 points. March 2023 Inflation Summary: Annual Inflation fell from 6.04% to 4.98% CPI Index rose from 300.840 to 301.836 Monthly Inflation for March was 0.33% Next release May … [Read more...]
