
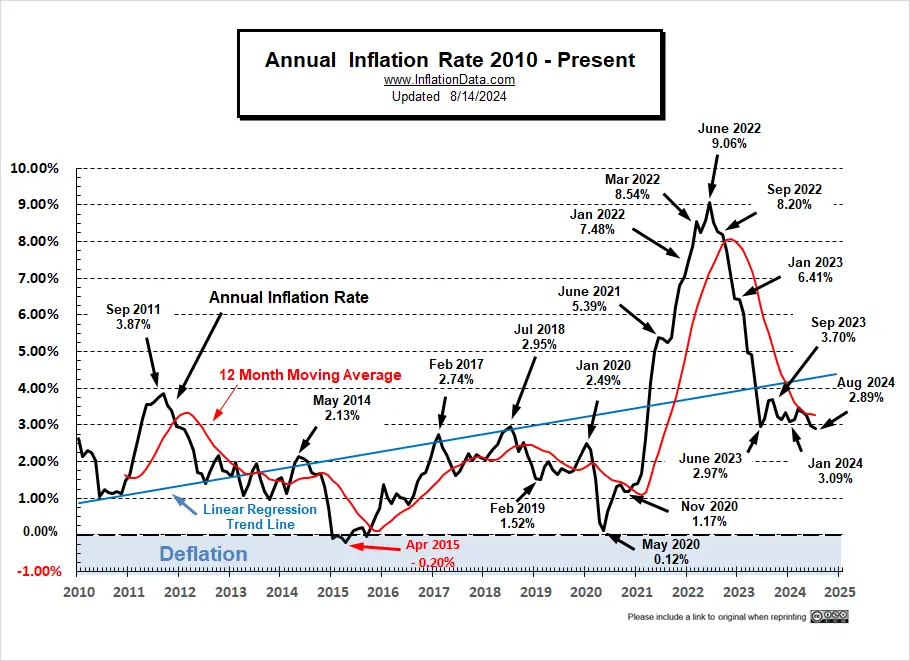
The U.S. Bureau of Labor Statistics released its July Inflation report on Wednesday August 14th showing Annual Inflation was down from 3% in June to 2.9%.
(But since we calculate it to two digits, it was actually 2.97% in June and 2.89% in July.) On a non-seasonally adjusted basis, monthly inflation in June was 0.03% and 0.12% in July. So despite monthly inflation being slightly higher in July 2024 than in June, it was lower than July 2023 (@0.19%) so Annual Inflation fell.  Economists had been predicting that the inflation rate would come in at 3.0% so inflation was lower than expectations, but Mr. Market didn’t celebrate much (only increasing about 1/2%) but the rally continued upward on Thursday.
With inflation falling and unemployment rising, the market is hoping for at least one interest rate cut this year and possibly two.
Monthly Inflation:
The next monthly component of the Annual Inflation Rate to fall out of the calculation is August 2023. With August 2023 having a relatively high monthly inflation of 0.44% we can expect annual inflation to fall next month. For instance, if August 2024’s monthly inflation is the same as July 2024’s (i.e., 0.12%) then annual inflation will be down to 2.57%. If it is the same as June (i.e., 0.03%) then annual inflation will drop to 2.48%. Of course, in the unlikely event that it is the same as August 2023 then the annual inflation rate will remain at 2.89%.
Last Month’s Projection for June: The actual decrease was below our “Extreme low” number.
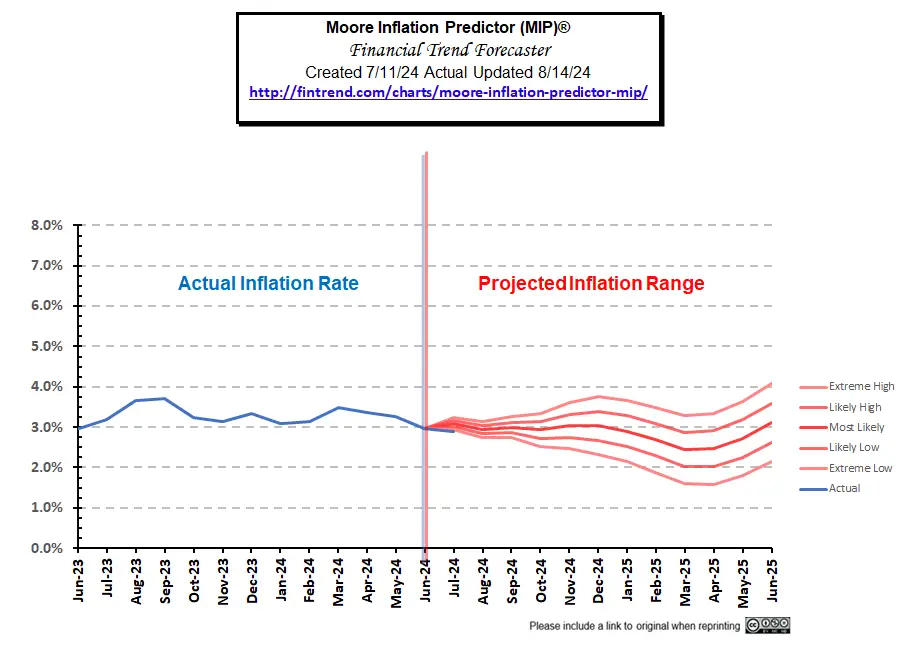
As you can see the actual inflation rate fell fairly sharply, putting it slightly below our “Extreme Low” projection and taking it from 2.97% down to 2.89%. Economists were predicting annual inflation to be 3.0%. We predicted an extreme low of 2.93% so the actual came in slightly below our extreme low prediction.
See this month’s MIP prediction
July 2024 Inflation Summary:
- Annual Inflation fell from 2.97% to 2.89%
- CPI Index rose from 314.175 to 314.540
- Monthly Inflation for July was 0.12%
- Next release Sept 11th 2024
| Jan | Feb | Mar | Apr | May | June | July | Aug | Sep | Oct | Nov | Dec | |
| 2022 | 7.48% | 7.87% | 8.54% | 8.26% | 8.58% | 9.06% | 8.52% | 8.26% | 8.20% | 7.75% | 7.11% | 6.45% |
| 2023 | 6.41% | 6.04% | 4.98% | 4.93% | 4.05% | 2.97% | 3.18% | 3.67% | 3.70% | 3.24% | 3.14% | 3.35% |
| 2024 | 3.09% | 3.15% | 3.48% | 3.36% | 3.27% | 2.97% | 2.89% |
BLS Commentary:
The BLS Commissioner reported:
“The Consumer Price Index for All Urban Consumers (CPI-U) increased 0.2 percent on a seasonally adjusted basis, after declining 0.1 percent in June, the U.S. Bureau of Labor Statistics reported today. Over the last 12 months, the all items index increased 2.9 percent before seasonal adjustment. The index for shelter rose 0.4 percent in July, accounting for nearly 90 percent of the monthly increase in the all items index. The energy index was unchanged over the month, after declining in the two preceding months. The index for food increased 0.2 percent in July, as it did in June. The food away from home index rose 0.2 percent over the month, and the food at home index increased 0.1 percent.”
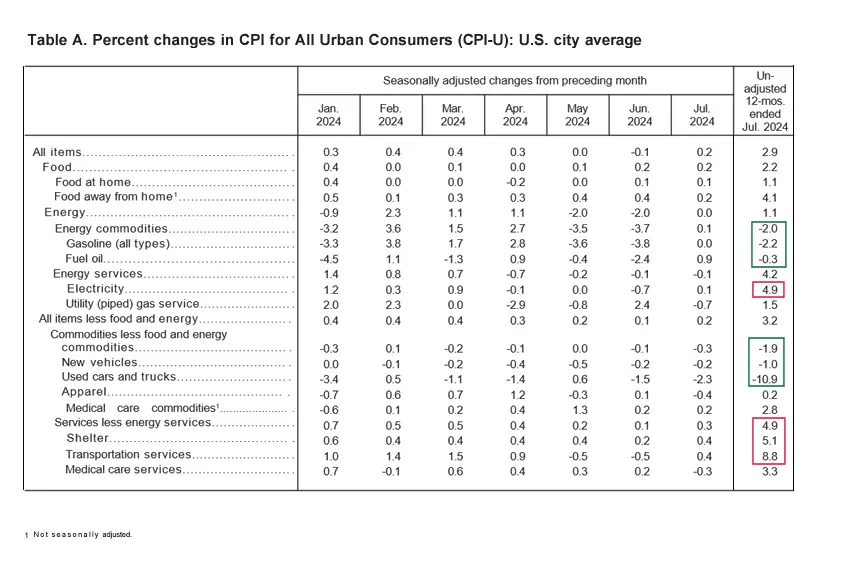
Looking at table A below we can see that on an annual basis energy and commodities are currently reducing overall inflation but Services are high.
The biggest gainers on an annual basis were Services like shelter and transportation services.
Although these “Seasonally Adjusted” numbers are slightly different than those presented by the BLS, the following chart from the Federal Reserve shows the gap between inflation with and without Food and Energy. Comparing the two we can see how much food and energy contribute toward overall inflation.
If the blue line is above the red line, food and energy, add to the overall inflation rate. But if blue is below the red line, they are actually mitigating overall inflation. With Energy prices on a monthly basis still negative they are still moderating overall inflation.
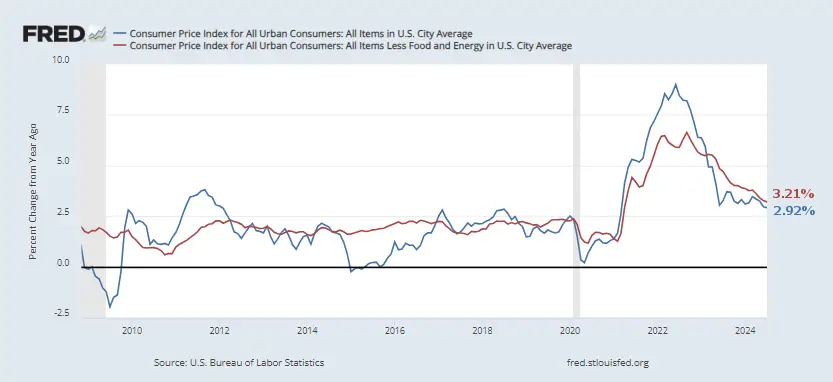
Source: St. Louis FED
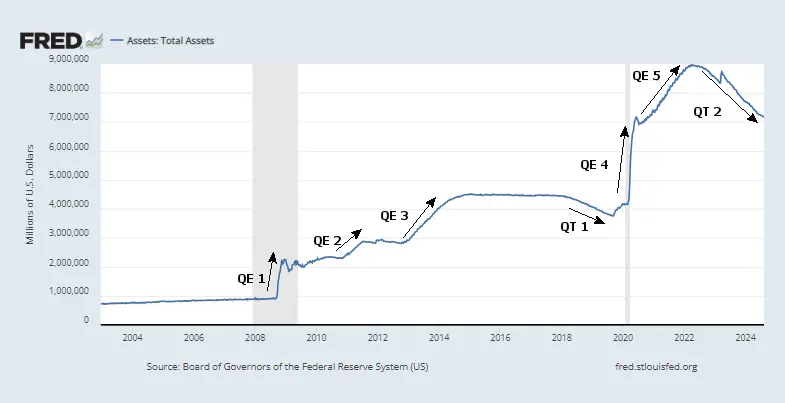
FED Assets
FED assets continue downward.
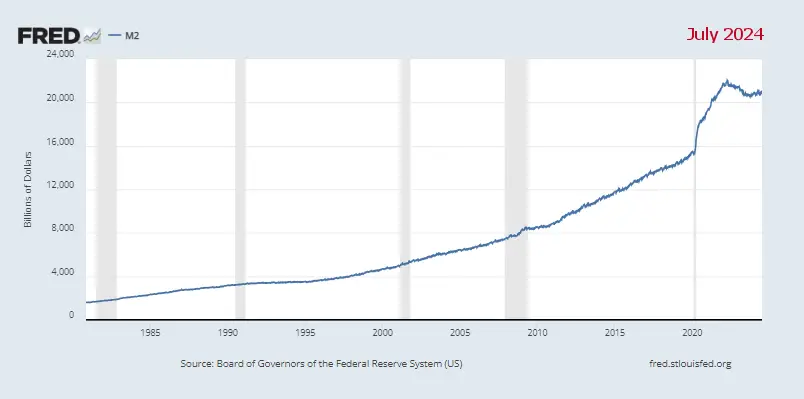
M2 Money Supply
But M2 money supply is trending upward.
More info about FED Monetary Policy and Inflation
Energy Prices
Overall energy prices have been down over the last year because the government was flooding the market with cheap oil by depleting our strategic petroleum reserves.
This chart from the U.S. EIA shows the extent of the recent strategic petroleum reserve drawdown it has started to tick up slowly in the last few months. Most recent data is May 2024.
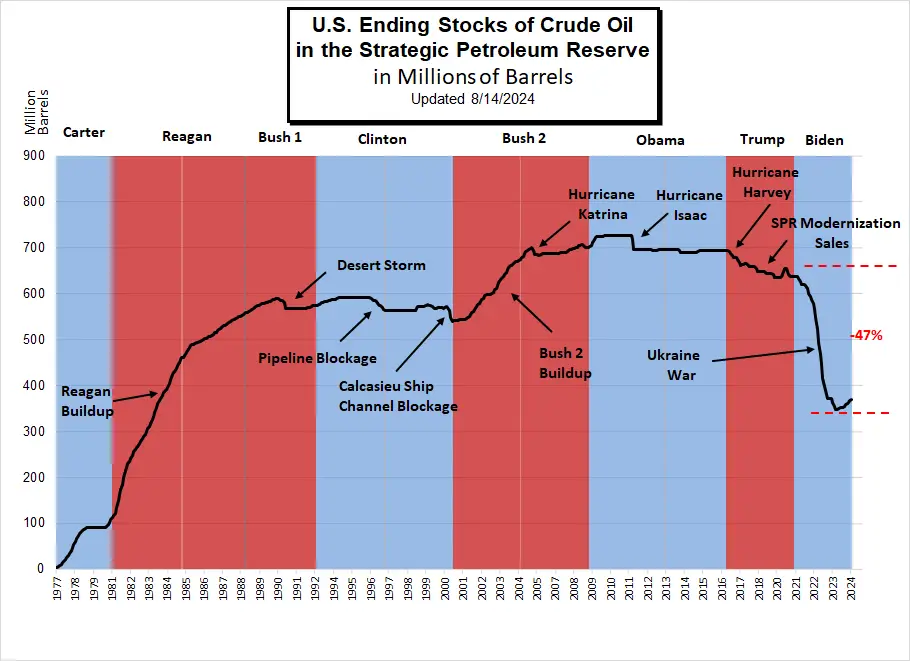
EIA Data History of SPR Releases
U.S. Ending Stocks of Crude Oil in SPR
(Million Barrels)
| Jan | Feb | Mar | Apr | May | Jun | Jul | Aug | Sep | Oct | Nov | Dec | |
| 2010 | 726.612 | 726.608 | 726.604 | 726.599 | 726.594 | 726.591 | 726.586 | 726.581 | 726.513 | 726.550 | 726.547 | 726.545 |
| 2020 | 634.967 | 634.967 | 634.967 | 637.826 | 648.326 | 656.023 | 656.140 | 647.530 | 642.186 | 638.556 | 638.085 | 638.086 |
| 2021 | 638.085 | 637.773 | 637.774 | 633.428 | 627.585 | 621.304 | 621.302 | 621.302 | 617.768 | 610.646 | 601.467 | 593.682 |
| 2022 | 588.317 | 578.872 | 566.061 | 547.866 | 523.109 | 493.324 | 468.006 | 445.057 | 416.393 | 398.569 | 388.419 | 372.030 |
| 2023 | 371.579 | 371.579 | 371.175 | 363.723 | 354.366 | 347.158 | 347.454 | 350.330 | 351.274 | 351.274 | 351.911 | 354.684 |
| 2024 | 358.013 | 360.958 | 363.934 | 366.917 | 370.167 | NA | NA | NA | NA | NA | NA | NA |
Inflation Chart
Monthly Inflation Compared to Previous Years:
The monthly inflation rate for July 2024 was 0.12%.
In the chart below, we can see how the UNADJUSTED monthly inflation compares between 2018 (light green), 2019 (light blue), 2020 (pink), 2021 (purple), 2022 (orange), 2023 (dark), 2024 (teal). Interestingly, January 2018 and January 2024 are identical. In 2024 monthly inflation started a bit higher than average at 0.54%, 0.62%, 0.65%, but April, May, and June 2024 came in significantly lower than 2023, which brought annual inflation down a bit. June was very low at 0.03% and July was slightly higher but still low at 0.12%.
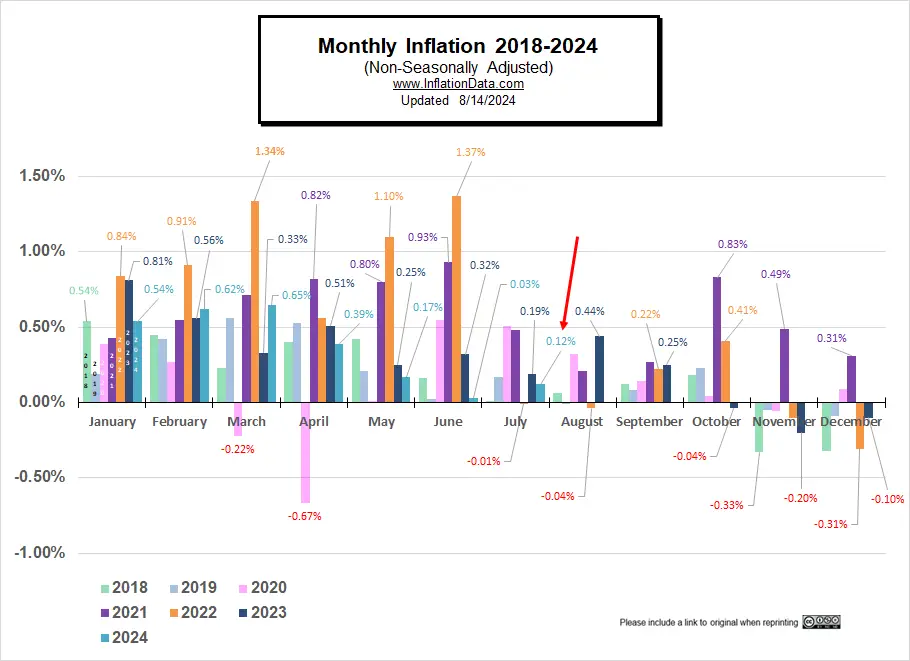
Not Seasonally Adjusted Monthly Inflation Rates
Note: January 2022’s 0.84% was the highest January since 1990. June was the highest June since 1941 (although the first quarter of 1980 had some higher rates). Typically, the first quarter has the highest monthly inflation and the 4th quarter is the lowest (even negative).
| Jan | Feb | Mar | Apr | May | Jun | Jul | Aug | Sep | Oct | Nov | Dec | |
| 2016 | 0.17% | 0.08% | 0.43% | 0.47% | 0.41% | 0.33% | (0.16%) | 0.09% | 0.24% | 0.12% | (0.16%) | 0.03% |
| 2017 | 0.58% | 0.31% | 0.08% | 0.30% | 0.09% | 0.09% | (0.07%) | 0.30% | 0.53% | (0.06%) | 0.002% | (0.06%) |
| 2018 | 0.54% | 0.45% | 0.23% | 0.40% | 0.42% | 0.16% | 0.01% | 0.06% | 0.12% | 0.18% | (0.33%) | (0.32%) |
| 2019 | 0.19% | 0.42% | 0.56% | 0.53% | 0.21% | 0.02% | 0.17% | (0.01%) | 0.08% | 0.23% | (0.05%) | (0.09%) |
| 2020 | 0.39% | 0.27% | (0.22%) | (0.67%) | 0.002% | 0.55% | 0.51% | 0.32% | 0.14% | 0.04% | (0.06%) | 0.09% |
| 2021 | 0.43% | 0.55% | 0.71% | 0.82% | 0.80% | 0.93% | 0.48% | 0.21% | 0.27% | 0.83% | 0.49% | 0.31% |
| 2022 | 0.84% | 0.91% | 1.34% | 0.56% | 1.10% | 1.37% | (0.01%) | (0.04%) | 0.22% | 0.41% | (0.10%) | (0.34%) |
| 2023 | 0.80% | 0.56% | 0.33% | 0.51% | 0.25% | 0.32% | 0.19% | 0.44% | 0.25% | (0.04%) | (0.20%) | (0.10%) |
| 2024 | 0.54% | 0.62% | 0.65% | 0.39% | 0.17% | 0.03% | 0.12% |
See: Monthly Inflation Rate for more information and a complete table of Unadjusted Monthly Rates.
Misery Index
Current Misery Index:
Unemployment 4.3% + Inflation 2.89% = 7.19%
Unemployment was up 0.2% but inflation was down less so the misery index rose..
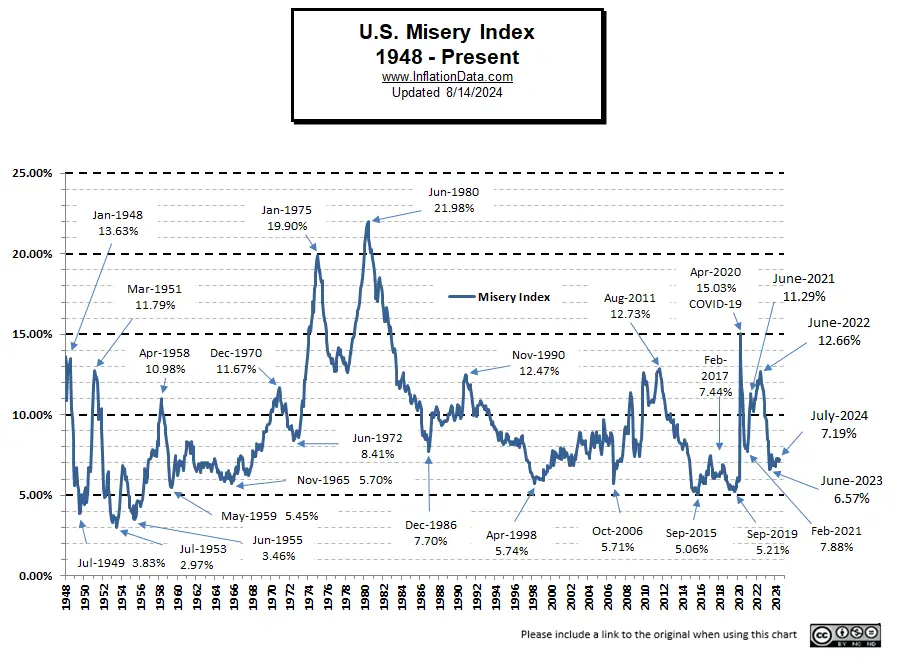
[Read More on the Misery Index…]
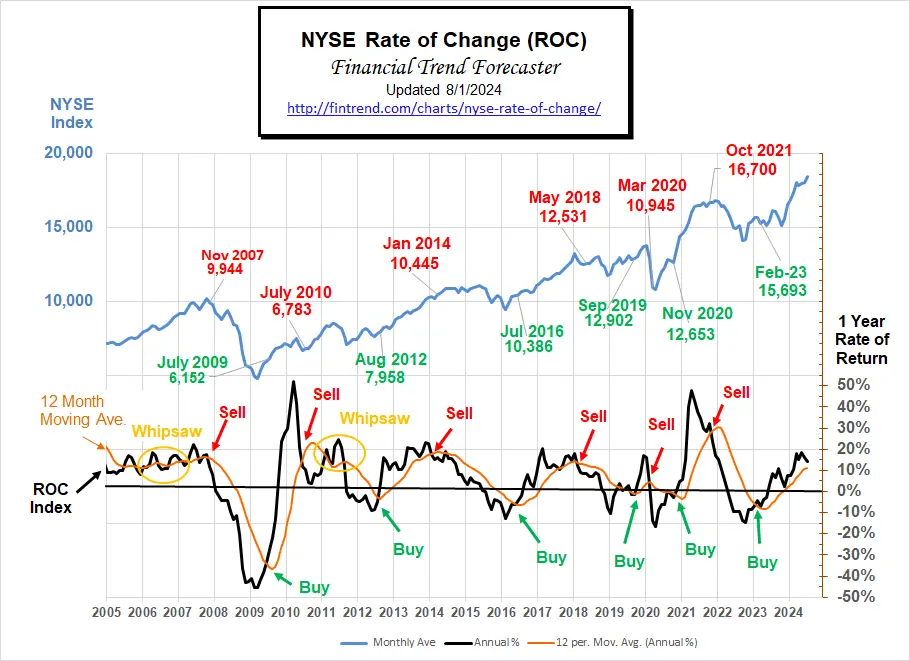
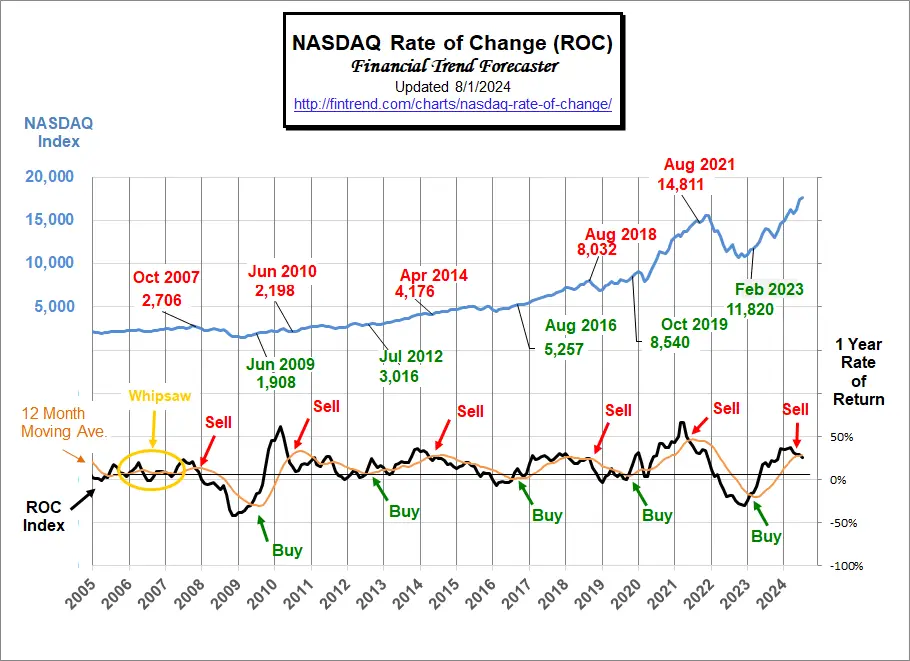
Rate of Change (ROC) Charts
We changed the ROC Format and added a Crypto ROC chart. The NYSE ROC continued upward through the end of July and retains a hold signal.
The NASDAQ ROC issued a Sell signal at the end of July (prior to the mini Yen crash).
Bitcoin also issued a tentative sell signal due to recent weakness in light of massive selling by the German government. See our new Crypto ROC for more information.
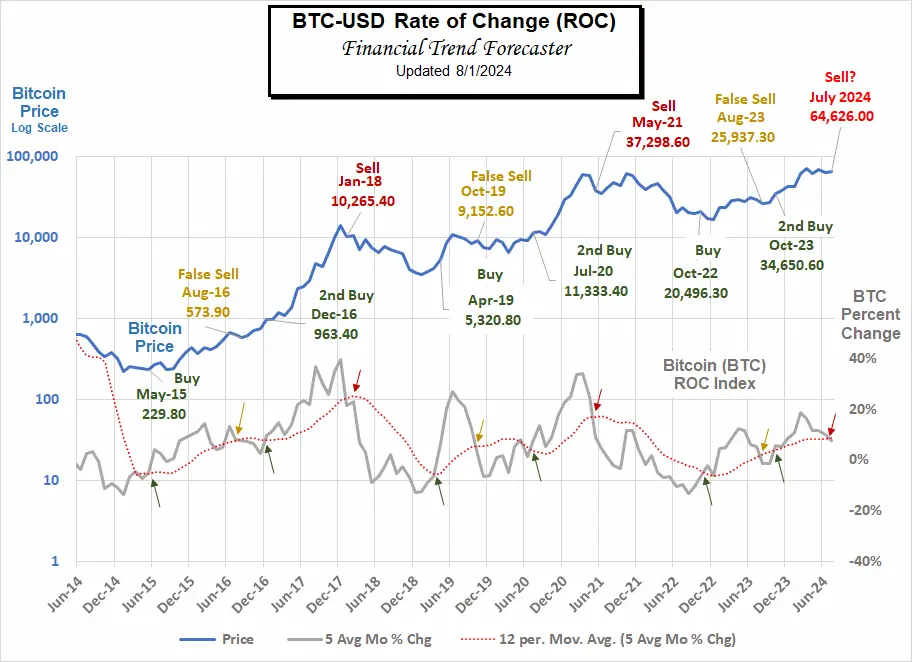
For more information, see NYSE Rate of Change (ROC) , NASDAQ ROC Chart, and Crypto ROC .
You Might Also Like:
From InflationData.com
- What Causes Stagflation?
- Inflation Causes Inequality
- Navigating High Inflation: Should You Buy, Sell, or Hold Off on Real Estate?
- Inflation’s Hidden Impact on Healthcare: What’s Driving Costs Up?
- The Death of the PetroDollar
From Financial Trend Forecaster
- Moore Inflation Predictor
- NYSE ROC
- NASDAQ ROC
- Modern Monetary Theory (MMT)
- Canada’s Economic Crisis
- Crypto: Crash or Opportunity?
- Bureaucracy: The Red Tape that Prevents Economic Growth
- How Washington and the Fed Caused the Commercial Real Estate Crisis
- The Results Are In: Free Market Capitalism Improves Lives
From UnemploymentData.com.
- July Jobs Report Spooks Stock Market
- Opportunities You Can Find With a CDL License
- June Employment Weak
- Why Consumer Sentiment Fell To A Seven-Month Low
- From Layoff to Lift-Off: Starting Your Own Construction Business
From Elliott Wave University
- This Trend Will Likely Soon Rock the U.S. Financial System
- Elliott Wave Analysis of Bitcoin
- Is a China-Taiwan Conflict Likely? Watch the Region’s Stock Market Indexes
- What New York City’s Art Auctions Tell You About the Stock Market — and Social Mood
- Why You Should Pay Attention to This Time-Tested Indicator Now
From OptioMoney
- Financial Considerations When Moving to Florida
- Splitting Your Golden Years:
- Home-Buying Guide for Newlyweds
- Smart Ways to Save for a Rainy Day Fund
From Your Family Finances
- Taxes After Retirement: What You Need To Know
- Conquer Your Debt: Tips for a Successful Financial Future
- Cost of Living Adjustments: Moving from the North to Florida
- What is Identity Theft and How to Protect Yourself
- Smart Spending for Your Roof: Navigating Costs and Options

Leave a Reply