
The U.S. Bureau of Labor Statistics (BLS) released its February Inflation report on March 11th, 2020, for the 12 months through the end of February 2020.
Annual Inflation Falls
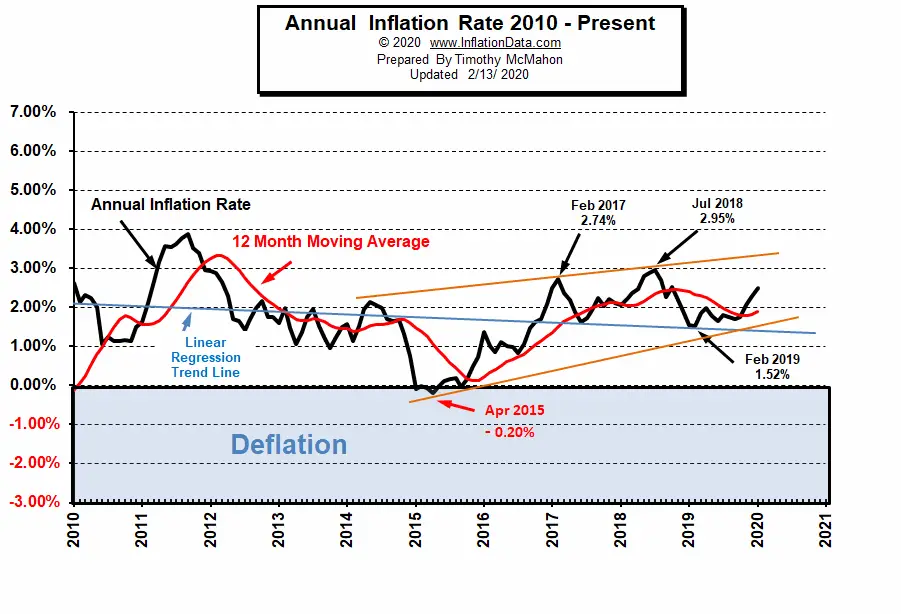
- Annual inflation fell from the high set at 2.49% in January to 2.33% in February.
- CPI Index in February was 258.678 up from January’s 257.971, December was 256.974, November was 257.208 down from October’s 257.346
- Monthly Inflation for January was 0.39%, while February was 0.27% down from 0.42% in February 2019.
- Next release April 10th
Currently, the inflation rate is above the FED’s target 2% rate. But the FED is concerned with a market meltdown due to falling Oil prices and the Coronavirus so they are following a loose monetary policy in an effort to prevent a market meltdown.
Monthly Inflation:
According to the BLS commissioner’s report, “The Consumer Price Index for All Urban Consumers (CPI-U) rose 0.1 percent in February on a seasonally adjusted basis, the same increase as in January, the U.S. Bureau of Labor Statistics reported today. Over the last 12 months, the all items index increased 2.3 percent before seasonal adjustment.
Increases in the indexes for shelter and for food were the main causes of the increase in the seasonally adjusted all items index, more than offsetting a decline in the energy index. The food index increased 0.4 percent over the month, with the food at home index rising 0.5 percent, its largest monthly increase since May 2014. The index for energy fell 2.0 percent in February, with all of its major component indexes declining.”
Read the full commentary here.
Seasonally Adjusted Inflation Table
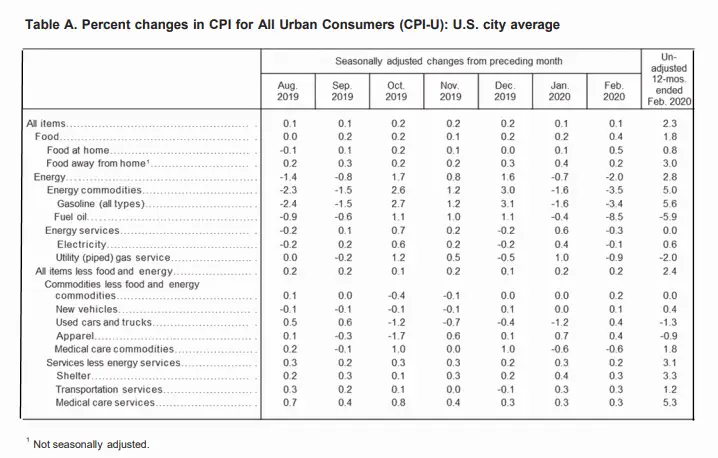
From the February 2020 column in the table above we can see that on a monthly seasonally adjusted basis, Gasoline was down -3.4%. On a Non-adjusted annual basis, however, gasoline was still up 5.6% over the year and fuel oil was down -5.9%. On an annual basis, Food was up 1.8%, shelter was up 3.3%, Used cars and trucks were down -1.3% and Medical care services were up 5.3%.
Current Inflation Chart
As we can see from the chart below, throughout 2019 the inflation rate stayed within a fairly narrow range. It crossed above its 12-month moving average in November at just above 2% in November (at 2.05%) while bottoming at 1.52% in February. In December it continued to rise to 2.29%. And January 2020 saw inflation zoom up to 2.49%. Then in February, we saw it fall slightly to 2.33%. Typically, monthly inflation is highest in the first 3 or 4 months of the year so we should see further drops later on in 2020.
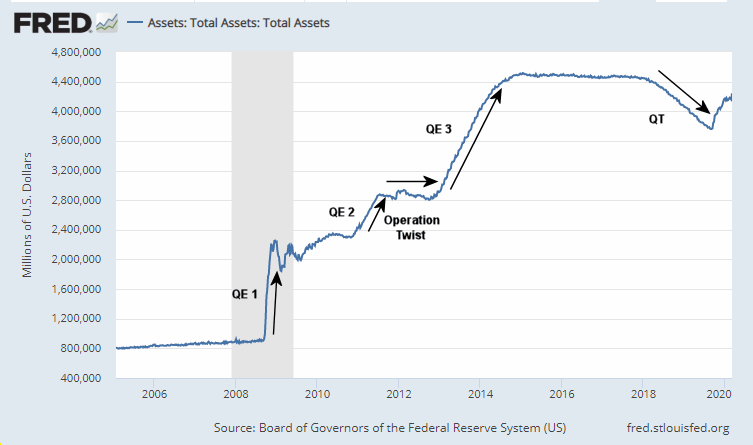
 Federal Reserve Actions
Throughout 2018 the FED followed a policy of “Quantitative Tightening” (QT) in addition to raising the FED Funds rate that they charge banks. QT is the opposite of Quantitative Easing. In “Quantitative Easing” (QE) the FED acquired government debt by buying it on the open market. QT is a process whereby the FED is reducing the debt that it is holding by not renewing Federal Debt that it holds when it matures. Normally, QE would be considered inflationary, while QT would be disinflationary. After the crash of 2008 when a lot of capital was destroyed QE was not strong enough inflationary to overcome all of the deflationary forces caused by the crash.
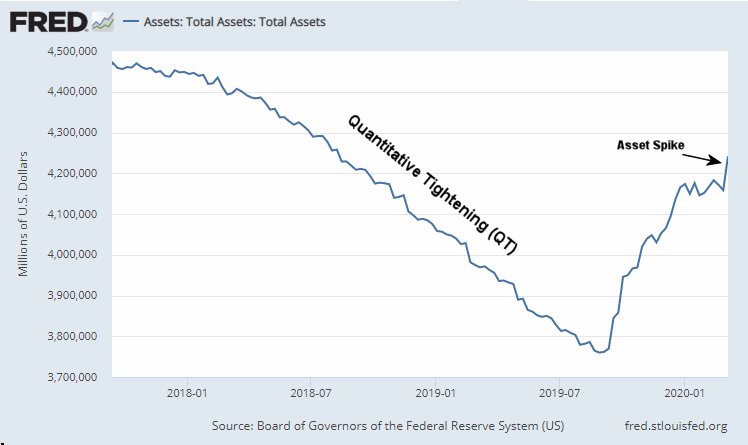
In this closer view, we can see the FED reduced “Assets” throughout 2018 and most of 2019 i.e. pursuing a tighter monetary policy. This caused the stock market to crash so Then they realized they went too far and increased assets for a couple of months at the end of 2019. Then December through January it was relatively flat and finally, it spiked up in February.
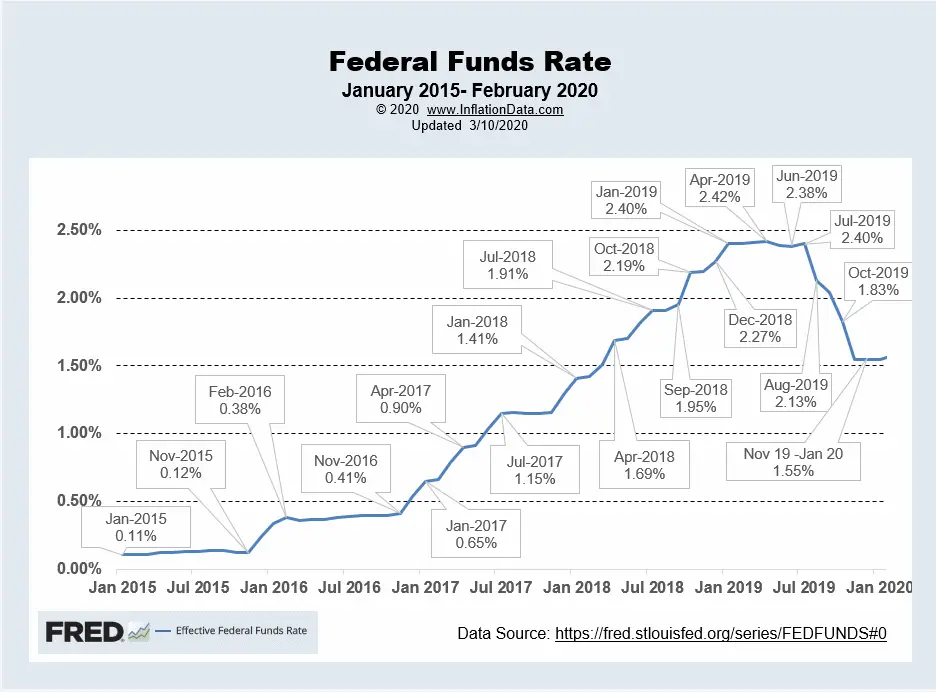
FED Funds Rate
The FED Funds rate leveled off, for the first half of 2019 around 2.4%. After July, the FED lowered the FED Funds rate significantly falling from 2.40% in July to 1.55% in November. The FED then halted the easing by holding the FED Funds rate steady at 1.55% from November through January. In February it slightly increased to 1.58% but in March due to Coronavirus fears, the FED set the target range to 1% to 1.25%. So next month’s chart should show a decline to that range.
 For more info See NYSE ROC and MIP.
Inflation Forecast
The following chart was our forecast for last month, projecting a decrease for the month. The median projection was 2.34%, the actual inflation rate was 2.33% so our projection was “right on the money”.
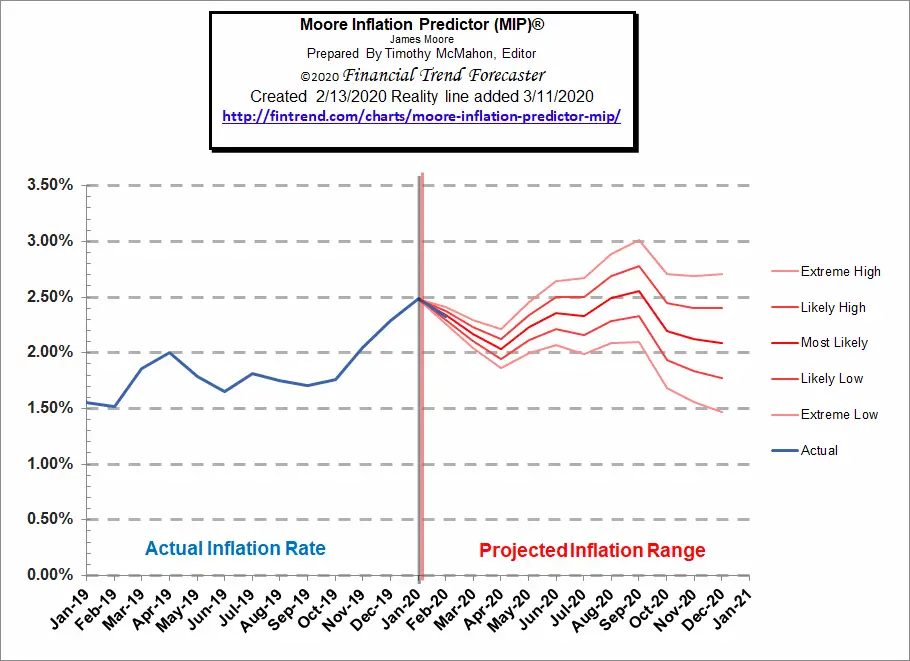
See our Moore Inflation Predictor to see our current projections.
Not Seasonally Adjusted Monthly Inflation Rates
| Jan | Feb | Mar | Apr | May | Jun | Jul | Aug | Sep | Oct | Nov | Dec | |
| 2016 | 0.17% | 0.08% | 0.43% | 0.47% | 0.41% | 0.33% | (0.16%) | 0.09% | 0.24% | 0.12% | (0.16%) | 0.03% |
| 2017 | 0.58% | 0.31% | 0.08% | 0.30% | 0.09% | 0.09% | (0.07%) | 0.30% | 0.53% | (0.06%) | 0.00% | (0.06%) |
| 2018 | 0.54% | 0.45% | 0.23% | 0.40% | 0.42% | 0.16% | 0.01% | 0.06% | 0.12% | 0.18% | (0.33%) | (0.32%) |
| 2019 | 0.19% | 0.42% | 0.56% | 0.53% | 0.21% | 0.02% | 0.17% | (0.01%) | 0.08% | 0.23% | (0.05%) | (0.09%) |
| 2020 | 0.39% | 0.27% |
See: Monthly Inflation Rate for more information and a complete table of Unadjusted Monthly Rates.
Misery Index
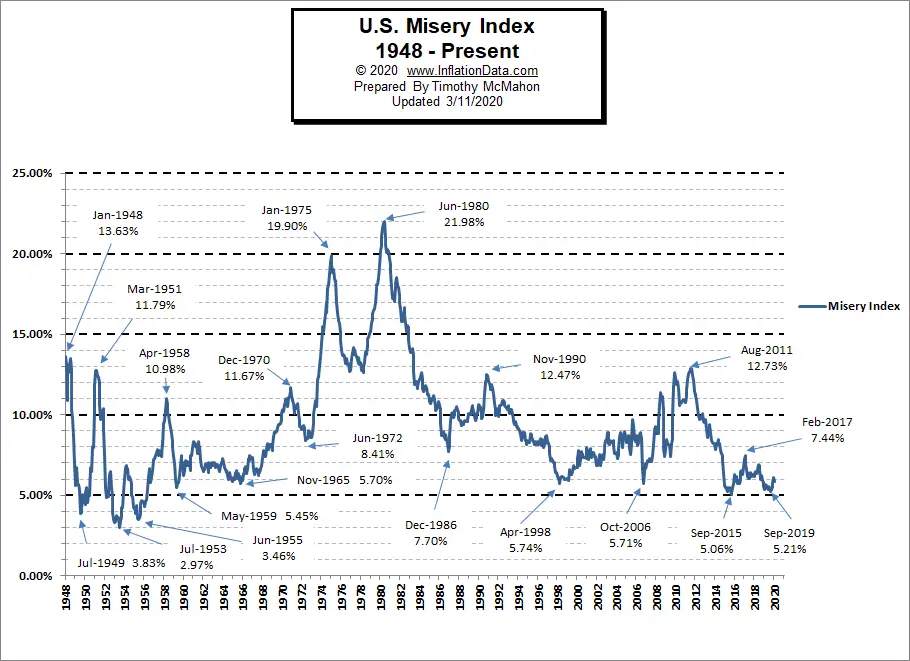
The misery index as of March 2020 (based on the most recent official government inflation and unemployment data for the 12 months ending in February) is at 5.83%. down slightly from 6.09% in January.
[Read More…]
NYSE Rate of Change (ROC)©
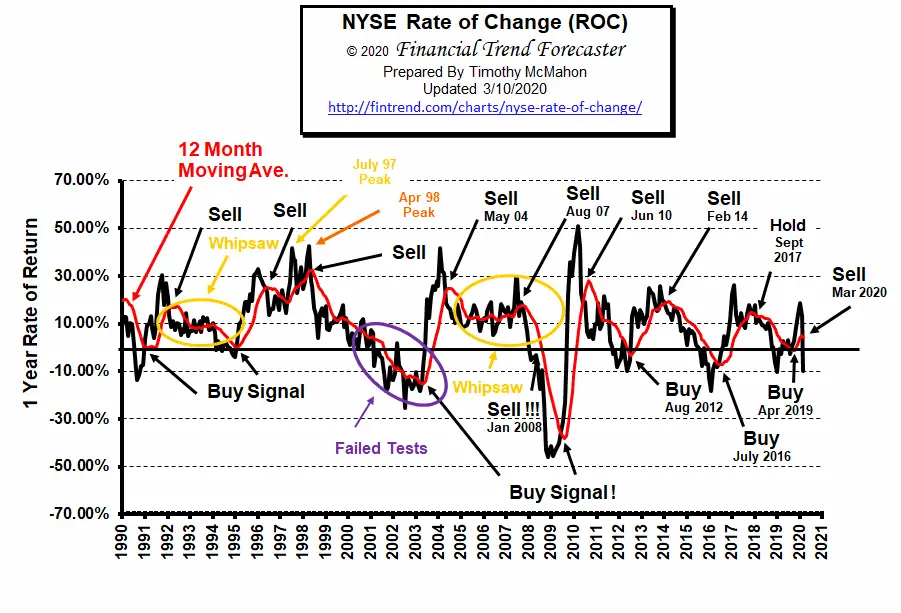
Sell Signal
After passing a milestone of doubling since the September 2011 low (up 108.8%) the market has been panicked into a massive “correction” by a combination of the CoronaVirus (COVID-19) and falling oil prices.
See the NYSE ROC for more info.
NASDAQ Rate of Change (ROC)©
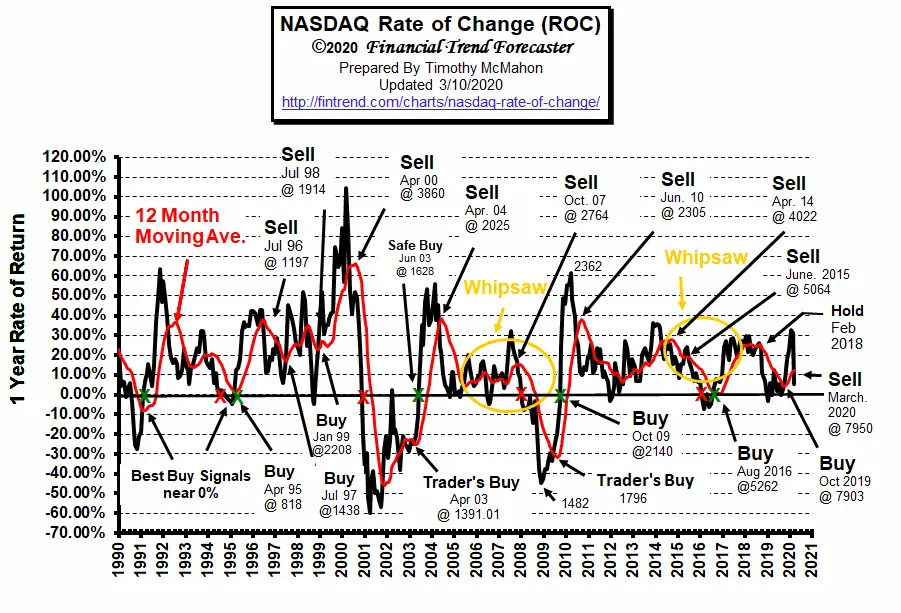
The NASDAQ ROC crossed sharply through its moving average generating a sell signal. However, unlike the NYSE ROC it has not crossed below the zero-line yet. The market is in freefall panic mode because of a combination of falling oil prices and the Corona Virus. Normally, falling oil prices could be seen as a positive as it reduces the cost of doing business. But of course, it would hurt the oil industry’s profits while helping everyone else. If the coronavirus turns out to be an overblown scare tactic the market could rebound quickly although it is currently taking a hit due to decreased tourism, and shipping/supply issues for products sourced from China.
See NASDAQ ROC for more.
Regional Inflation Information
The U.S. Bureau of Labor Statistics also produces regional data. So if you are interested in more localized inflation information you can find it here.
| AL | AK | AR | AZ | CA | CT | CO | DC | DE | FL | GA | GU | HI | IA |
| ID | IL | IN | KS | KY | LA | MA | MD | ME | MI | MN | MO | MS | MT |
| NC | ND | NE | NH | NJ | NM | NV | NY | OH | OK | OR | PA | PR | RI |
| SC | SC | SD | TX | UT | VA | VI | VT | WI | WA | WI | WV |
You Might Also Like:
From InflationData.com
- Inflation: The Hidden Tax
- How the FED Controls the Money Supply
- January Inflation Spikes to 2.49%
- Modern Monetary Theory
- Investing to Fight Inflation
- What Impact Does Interest Rates and Inflation Targets Have on Stocks?
Read more on UnemploymentData.com.
- Developing an Employee Reward Program
- What are the Top Paying Positions for MBA Graduates?
- How to Improve Morale in the Workplace
- Learn a Skill in 2 Years: The Top 3 Trade Careers
- Labor of Love: 5 Tips for Finding a Career You’re Passionate About
From Financial Trend Forecaster
- Oil Is Now More Volatile Than Bitcoin
- Financial Real Estate Trends Investors Should Understand for 2020
- Gold is Still King of the Investing Market
- The Markets in Perspective: What Goes up Must Come down?
From Elliott Wave University
- Repeating Patterns = Profit Potential
- The Beginning of a Long-Term “Secular” Bull Market?
- What Does this Rare & Rapid Drop in Manufacturing Mean?
- Bullish Signal Has Only Happened 10 Times in the Last 94 Years.
From OptioMoney.com
- Learning to Trade from Video Tutorials
- How Saxo Bank Democratizes Trading and Investment
- Five Business Tips to Help Your Company Thrive
- Have Minimal Car Insurance? What to Do in Case of an Accident
- How to Choose a Residential Roofing Contractor
From Your Family Finances

Leave a Reply