
The U.S. Bureau of Labor Statistics released the Annual Inflation Rate data for the year through the end of December on January 12th 2018.
- Annual inflation was 2.11% for the 12 months ending in December
- CPI-U down slightly from 246.669 to 246.524
- Monthly Inflation for December -0.06%
- Next release February 14th
Annual Inflation Chart
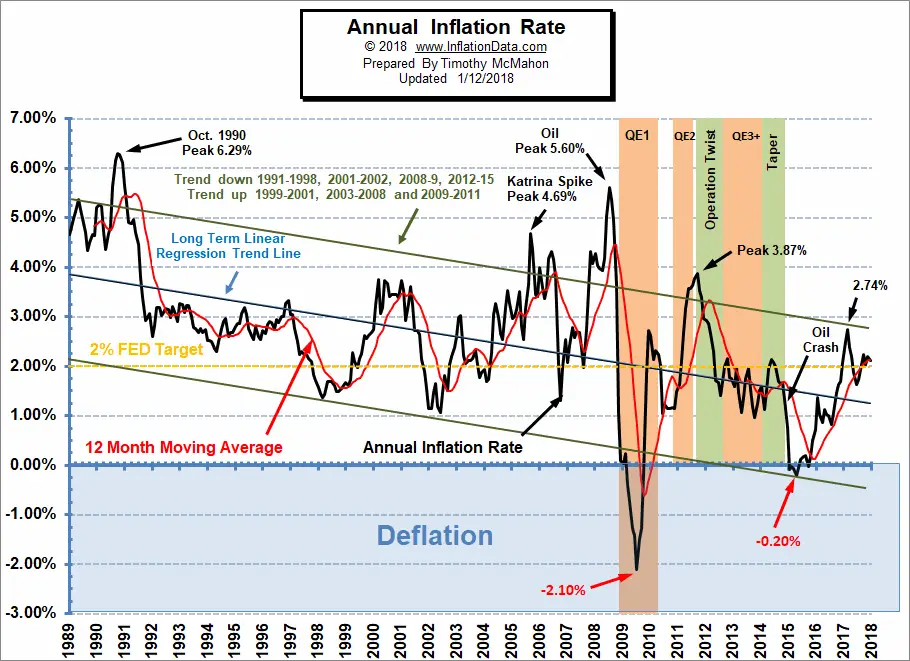 Annual inflation for the 12 months ending in December 2017 was 2.11% down from 2.20% in November and slightly above the 2.04% in October. Early in 2017 inflation was above current levels at 2.50% in January, 2.74% in February, 2.38% in March, and then falling to 2.20% in April. The annual cyclical low was 0.84% in July 2016. The longer term cyclical low of -0.20% was in April of 2015. Inflation May – August 2017 was below current levels at 1.87% in May, 1.63% in June, 1.73% in July, and 1.94% in August.
See Annual Inflation Chart for more info.
Monthly Inflation is Negative
| Date | CPI Index | Monthly Inflation |
| December 2016 | 241.432 | 0.03% |
| August 2017 | 245.519 | 0.30% |
| September 2017 | 246.819 | 0.53% |
| October 2017 | 246.663 | -0.06% |
| November 2017 | 246.669 | 0.002% |
| December 2017 | 246.524 | -0.06% |
In the table above we can see that the monthly inflation rate for December 2017 was negative. This means that the CPI index (i.e. price levels) was lower than the previous month i.e. 246.524 in December versus 246.669 in November. Whenever the monthly inflation rate is negative that is called “disinflation” (i.e. prices have gone down since the previous month). In November the CPI-U increased minimally from 246.663 in October to 246.669 this resulted in a monthly inflation for November of 0.002%, essentially zero since it is less than we normally measure. From the table we can gather some other information. From August to September prices rose from 245.519 to 246.819 this resulted in 0.53% monthly inflation (i.e. roughly 1/2%). But we can also see that in addition to December prices being below November prices they are actually below October’s prices and September’s as well. Although they are still above August’s prices. Prices generally fall during the 4th quarter (or at least rise the least) so this is pretty normal.
We can also see that the CPI index is higher than the previous December. If prices had fallen below December 2016 levels that would be called deflation. So we do not have “deflation” i.e. if the annual inflation rate is negative that is called “deflation“.
Monthly Seasonally Adjusted Data
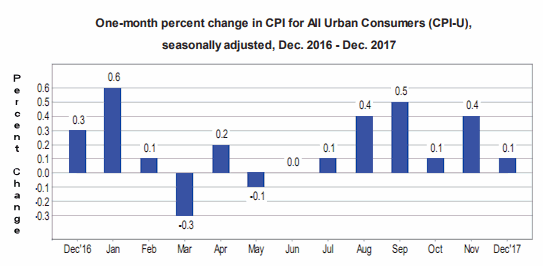
In the Bar-chart above, from the U.S. Bureau of Labor Statistics, we can see that when “Seasonally Adjusted” December’s -0.06% results in a positive 0.1%. This means that typically December’s monthly inflation is lower than -0.06%. Interestingly, November is typically 0.4% lower than “Zero percent”.
The Commissioner’s Report
According to the U.S. Bureau of Labor Statistics (BLS) commissioner’s report- “The index for all items less food and energy increased 0.3 percent in December, its largest increase since January 2017. Along with the shelter index, the indexes for medical care, used cars and trucks, new vehicles, and motor vehicle insurance were among those that increased in December. The indexes for apparel, airline fares, and tobacco all declined over the month… The food index increased 0.2 percent in December. The index for food at home rose 0.1 percent, largely due to a 0.9-percent increase in the index for meats, poultry, fish, and eggs, its largest increase since June 2015… The energy index declined 1.2 percent in December following a 3.9-percent increase in November. The gasoline index fell 2.7 percent in December after rising 7.3 percent in November. (Before seasonal adjustment, gasoline prices decreased 3.3 percent in December.) The electricity index increased 0.1 percent in December. The index for natural gas increased 1.2 percent, its largest increase since May 2017. All the major energy component indexes increased over the past 12 months. The gasoline index rose 10.7 percent, the electricity index advanced 2.6 percent, and the index for natural gas increased 4.7 percent.”
Misery Index
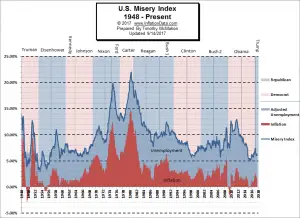 The misery index as of January 2018 (based on the most recent official government inflation and unemployment data for the 12 months ending in December) is at 6.21% (4.1% unemployment and 2.11% inflation) down from 6.43% in September but slightly above the 6.14% in October and still less than half of the peak of 12.87% in both October and November 2011 which was pretty miserable. With unemployment unchanged and inflation down slightly for the month, the Misery index is well below the February 2017 peak of 7.44%. The average inflation rate since the beginning of the Misery Index in January 1948 is 3.53% which is significantly higher than current inflation levels… so if inflation were “average” the misery index would be higher.
[Read More…]
Moore Inflation Predictor
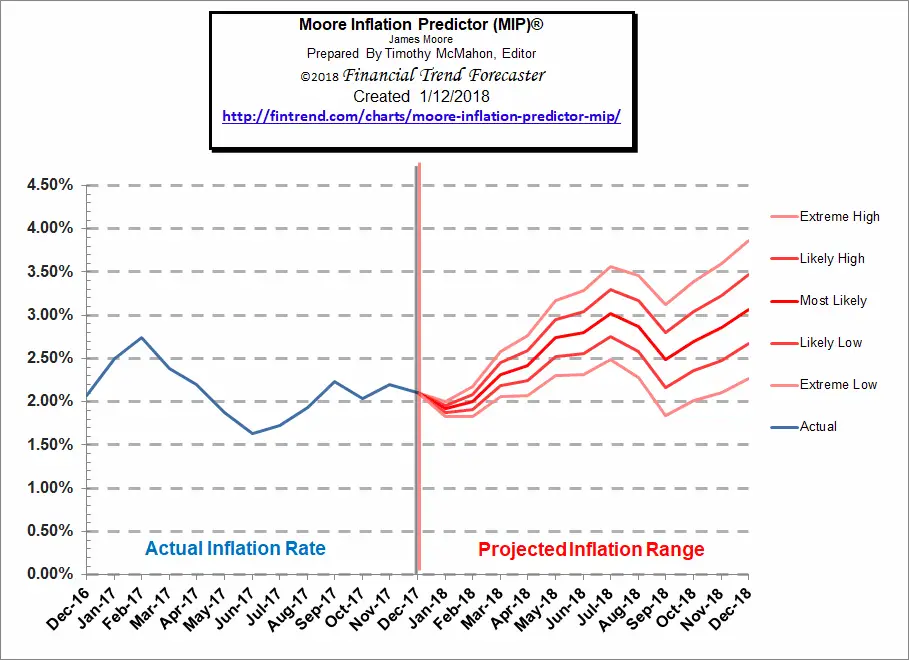 Last month our MIP Chart was projecting a down move with a range from 2.02% to 2.12%. With the result coming in at 2.11% although it was at the high end of our projection it was still within the range. This month, the MIP is projecting another down move possibly taking the Annual inflation rate back below 2% next month but then rising again after February.
See Moore Inflation Forecast for more info.
NYSE Rate of Change (ROC)©
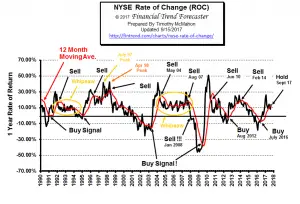 The NYSE index has entered the “Whipsaw period” being above its moving average in November, below in December and back above again in January. Last month we said, “However at this point in the cycle we could very well be seeing a whipsaw and with the annual rate of return at 14% we wouldn’t jump to sell too quickly.” Which is why we have labeled it “Hold”.
NASDAQ Rate of Change (ROC)©
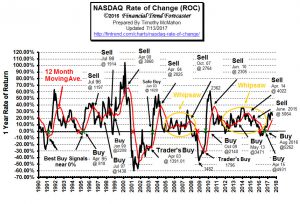
NASDAQ ROC remains above its moving average thus avoiding a Sell signal, but appears to be losing momentum, making us a bit cautious thus the “hold” signal. Just as with the NYSE ROC we are probably entering “Whipsaw Territory” but with annual rates of return above 20% we don’t want to exit too early.
See NASDAQ ROC for more.
You Might Also Like:
Read more on UnemploymentData.com.
- How Companies Can Monitor and Anticipate Financial Trends
- Keys to Advancing in Your Chosen Career
- December Retail Employment Down
- Out of Work? 5 Ways to Stretch Your Budget until You Find a New Job
- Seeking to Succeed? 14 Ways to Get an Edge in the Business World
- Dealing with Workplace Stress and Squabbles
- How the Medical Industry is Poised for an Employee Boom
From InflationData.com
- Zero Monthly Inflation, Annual Inflation UP
- How Oil Prices Affect Inflation
- October Data says Disinflation
- Ways Inflation Affects the Real Estate Market Pt. 2
- Ways Inflation Affects the Real Estate Market
- The Quantity Theory of Money
From Financial Trend Forecaster
- Work From Home Trends To Expect In 2018
- Big Picture Update on Commodities & Precious Metals
- Three Trends in America’s Student Debt Today
- Has the Gold Rally Begun?
- Meet The World’s Most Powerful Bitcoin Backers
- Brexit and House Prices – What’s going on?
From Elliott Wave University
- New Long-Term Equity Breakout
- A Method Traders Can Use to Confirm an Elliott Wave Count
- U.S. Stocks: A Sentiment Extreme You MUST Pay Attention to
- 12 Real-Life Techniques That Will Make You a Better Trader Now
- Did You See the 30% Rise in This Major Global Stock Index?
- Silver Chart of the Day
From OptioMoney.com
- How Pro Homeowners Pay off Their Mortgage Faster Than Their Neighbors
- How Turning Your House Into a Smart Home Can Save You Money
- Learn about Loans: 5 Credit-Building Tips New Borrowers Should Know
- Educational Cost Comparisons
- Financial Figures: How to Budget for a Mortgage
- Finding Creative Ways to Save
From Your Family Finances
- Say Hello to a Good Buy: How to Make Financing a Car Less Complicated
- Big Family? Top Strategies for Saving on Utilities
- Let It Snow! 5 Expensive Winter Problems to Avoid
- Negotiating a Good Deal on a New Car
- Renting an Older Home? 4 Utility Cost-Saving Updates
- How Parents Can Help Their Teens Learn to Manage Money
- Looking To Invest? Bonds To Consider

Leave a Reply