
Inflation Summary:
- Annual Inflation up sharply to ~5% (actually 4.99%)
- CPI Index rose from 267.054 in April to 269.195 in May.
- Monthly Inflation for April was 0.82% and 0.80% in May.
- We have to go back to the Oil Peak of 2008 to see higher inflation.
- Next release July 13th
Annual inflation for the 12 months ending in May was 4.99%
Since February, we have been predicting Annual Inflation would shoot up in March and April due to negative numbers falling out of the annual calculation. Although May 2020 was not negative it was virtually zero so replacing it with a massive 0.80% monthly inflation caused the Annual inflation rate to soar once more.
Since the BLS rounds their numbers to 1 decimal place they reported May as 5.0% taking annual inflation to 2½ times the FED’s 2% target rate.
Due to the Saudi/Russia oil price war and the Corona Virus, monthly inflation in March, April, and May 2020 were -0.22%, -0.67%, and 0.002% respectively resulting in a massive disinflationary environment.
March 2021 was 0.71% which replaced the -0.22% causing a 0.93% increase in the annual inflation rate.
April 2021’s massive 0.82% replaced the negative -0.67% causing a 1.49% increase in the annual inflation rate.
May 2021’s 0.80% replaced May 2020’s virtually zero number giving Annual Inflation another almost 0.8% boost.
Coming Soon:
June 2020’s monthly inflation was 0.55%, so if we get another 0.80% month, inflation will go up. On the other hand, if we get normal summer inflation i.e. from 0.20% to 0.30% annual inflation will go down.
BLS Commissioner’s Inflation Report:
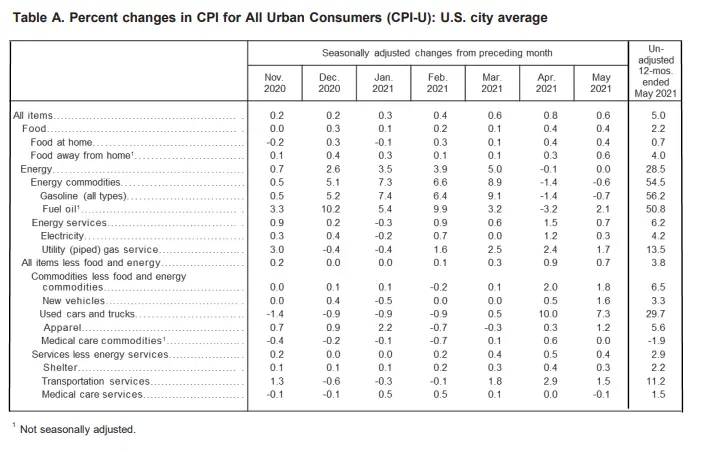
According to the BLS commissioner’s report, “The Consumer Price Index for All Urban Consumers (CPI-U) increased 0.6 percent in May on a seasonally adjusted basis after rising 0.8 percent in April, the U.S. Bureau of Labor Statistics reported today. Over the last 12 months, the all items index increased 5.0 percent before seasonal adjustment; this was the largest 12-month increase since a 5.4-percent increase for the period ending August 2008.”
The major components of annual inflation were energy up 28.5% over year ago levels, and used vehicles up 29.7% over last year.
For more information see the price changes in various components of the Consumer Price Index over the last 20 years.
Seasonally Adjusted Inflation Components Table
 The Inflation rate is calculated using the Current Consumer Price Index (CPI-U) published monthly by the Bureau of Labor Statistics. CPI Index Release Dates
Annual Inflation Chart:
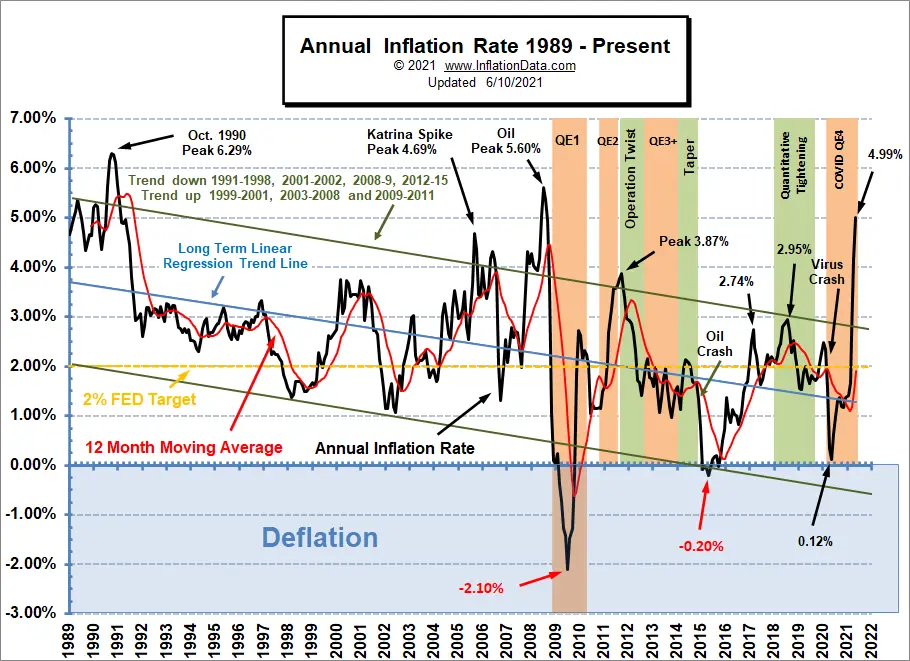
Annual inflation has soared out of the top of the channel and exceeds the peaks all the way back to (and including) September 2011. We have to go back to the Oil Peak of 2008 to see higher inflation.
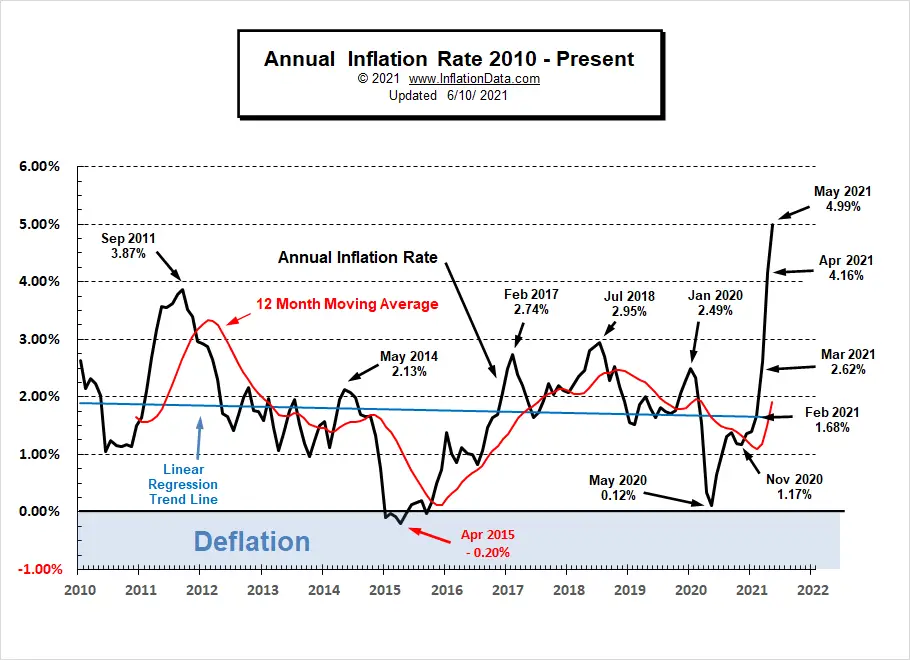
Current Inflation Situation
Looking at just the most recent years since 2010, we can easily see the current levels are more than 1% higher than September 2011.
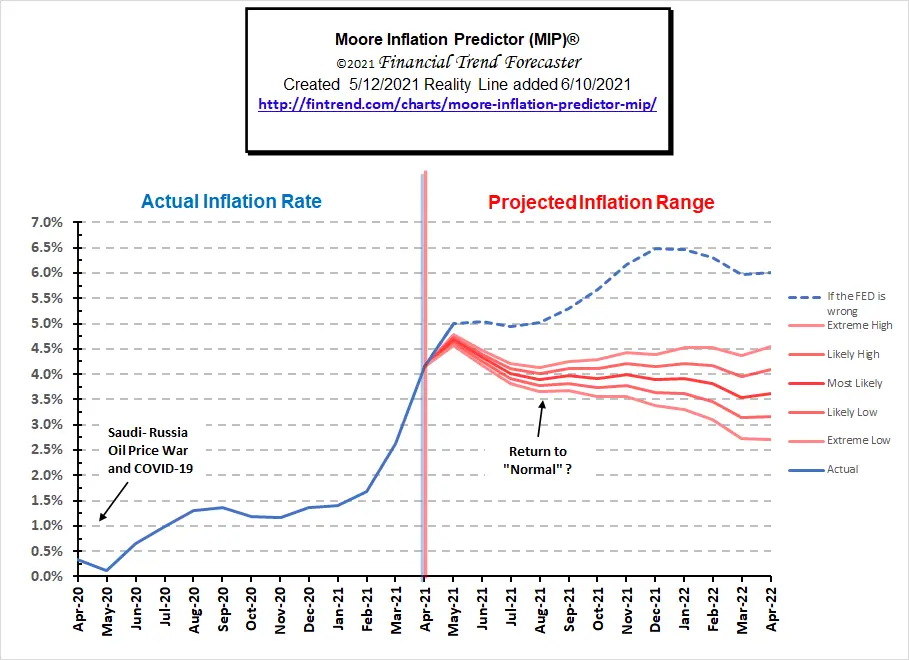
 Moore Inflation Predictor (MIP)
This month we will continue with the dotted blue line projecting what will happen if the FED is wrong and inflation doesn’t return to normal. Worst case scenario we could see 6.5% inflation by December if the FED’s money loose money policy results in consumer price inflation rather than just inflating the stock market. The projected decline is possible since last year saw higher than normal summer months (to make up for the lower than normal spring). So if this year has normal inflation during the summer, fall, and winter inflation could fall back to 3.5% but with the FED’s massive quantitative easing much higher inflation is also possible.
Here is last month’s MIP projection with the reality line added. As you can see the reality line is precisely on the “if the FED is wrong” line.
See: Moore Inflation Predictor for current info
Not Seasonally Adjusted Monthly Inflation Rates
We can see from the table below that every month so far in 2021 is higher than the corresponding month in either 2019 or 2020.
| Jan | Feb | Mar | Apr | May | Jun | Jul | Aug | Sep | Oct | Nov | Dec | |
| 2016 | 0.17% | 0.08% | 0.43% | 0.47% | 0.41% | 0.33% | (0.16%) | 0.09% | 0.24% | 0.12% | (0.16%) | 0.03% |
| 2017 | 0.58% | 0.31% | 0.08% | 0.30% | 0.09% | 0.09% | (0.07%) | 0.30% | 0.53% | (0.06%) | 0.002% | (0.06%) |
| 2018 | 0.54% | 0.45% | 0.23% | 0.40% | 0.42% | 0.16% | 0.01% | 0.06% | 0.12% | 0.18% | (0.33%) | (0.32%) |
| 2019 | 0.19% | 0.42% | 0.56% | 0.53% | 0.21% | 0.02% | 0.17% | (0.01%) | 0.08% | 0.23% | (0.05%) | (0.09%) |
| 2020 | 0.39% | 0.27% | (0.22%) | (0.67%) | 0.002% | 0.55% | 0.51% | 0.32% | 0.14% | 0.04% | (0.06%) | 0.09% |
| 2021 | 0.43% | 0.55% | 0.71% | 0.82% | 0.80% |
See: Monthly Inflation Rate for more information and a complete table of Unadjusted Monthly Rates.
For more information See Annual Inflation.
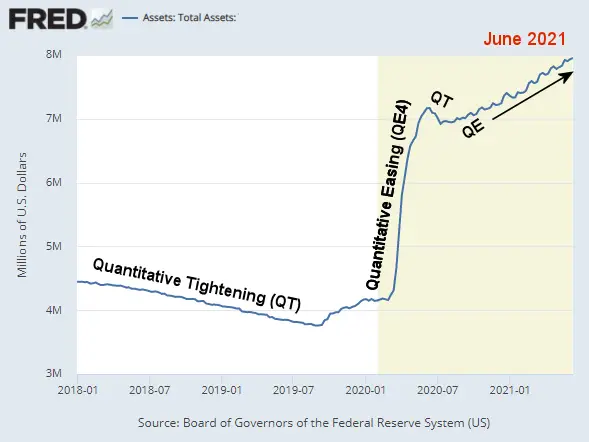
Federal Reserve Actions
After the massive QE increase beginning in March 2020, the FED tried tightening from June 10th through July 8th. That small QT caused concern among many market analysts but then the money began flowing again… as we saw a progressive increase in the money supply through present times See NYSE ROC for more info.
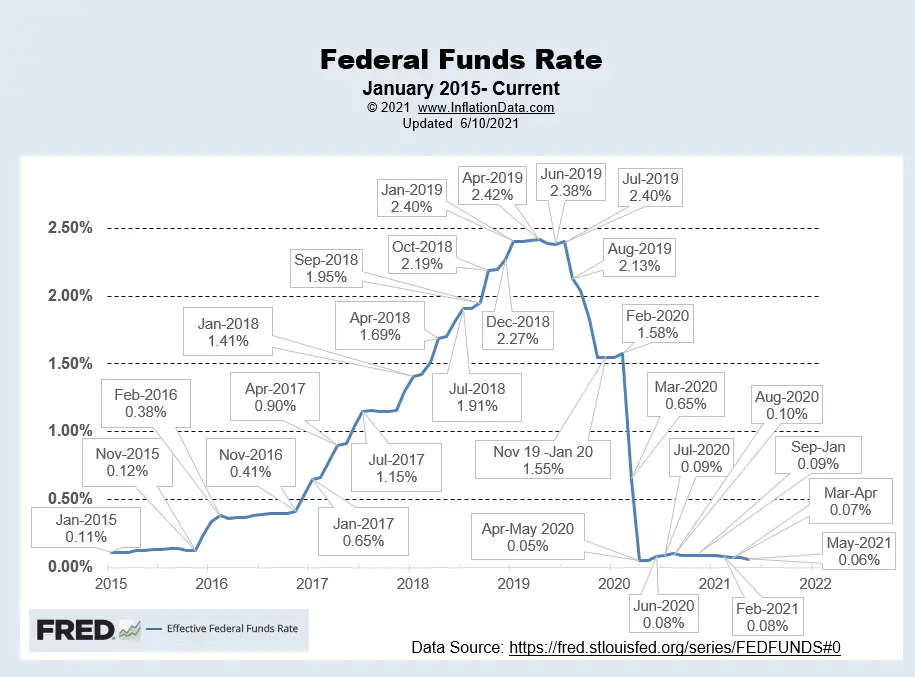
FED Funds Rate
In the chart below, we can see that the FED Funds Rate peaked at 2.42% in April 2019 then in an effort to stave off a market crash the FED dropped it to 1.55% by November at 1.55% where it stayed until February. At that point, COVID tanked the market, and the FED loosened rates to virtually zero (actually 0.05%) five one-hundredths of a percent. From there they inched it up to 0.10% (i.e. one-tenth of 1%) by August. Interestingly, even that was too high because they lowered it in September back to 0.09% and slowly lowered it back to 0.06% in May. My question is why lower it in May with inflation soaring in April?
Chart Source St Louis FED.
For more info See NYSE ROC and MIP.
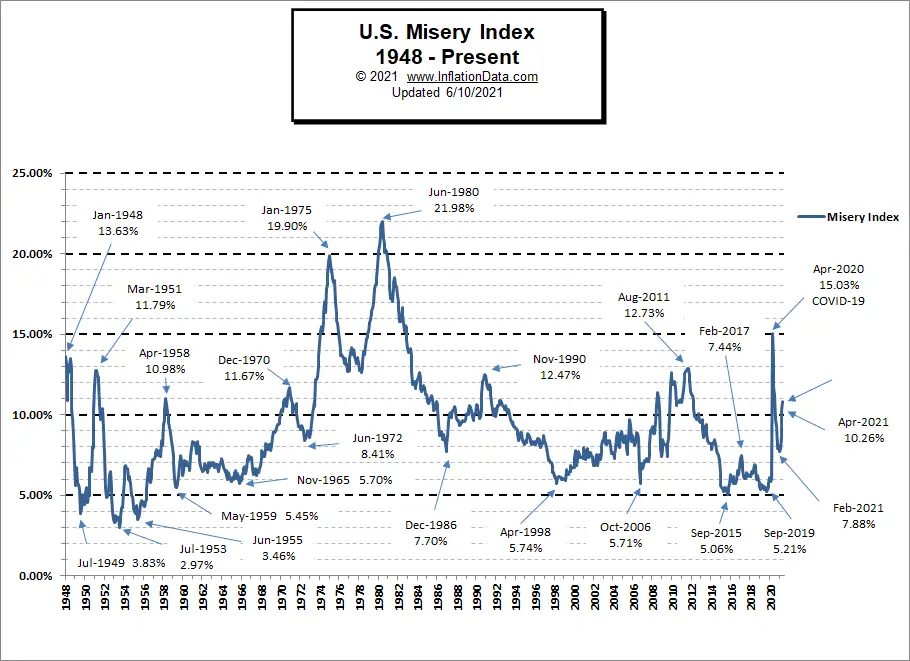
Misery Index
In 2020, the Misery index peaked at 15.03% in April when the country shut down due to the COVID scare. This was just two months after making the low for the year at 5.83% up slightly from the September 2019 low.
So far in 2021, the low was in January at 7.70% and it has steadily increased to 10.79% in May. Despite falling unemployment, inflation has been rising faster than unemployment has fallen.
[Read More…]
NYSE Rate of Change (ROC)©

Hold? Signal (Whipsaw)
This month’s NYSE ROC chart shows a decline after the massive spike due to comparing against the “V” shaped COVID drop of March/April 2020.
See the NYSE ROC for more info.
NASDAQ Rate of Change (ROC)©

Hold Signal????
The NASDAQ ROC has fallen below its moving average but…
See NASDAQ ROC for more.
Regional Inflation Information
The U.S. Bureau of Labor Statistics also produces regional data. So if you are interested in more localized inflation information you can find it here.
| AL | AK | AR | AZ | CA | CT | CO | DC | DE | FL | GA | GU | HI | IA |
| ID | IL | IN | KS | KY | LA | MA | MD | ME | MI | MN | MO | MS | MT |
| NC | ND | NE | NH | NJ | NM | NV | NY | OH | OK | OR | PA | PR | RI |
| SC | SC | SD | TX | UT | VA | VI | VT | WI | WA | WI | WV |
You Might Also Like:
From InflationData.com
- The 3 Stages of Inflation
- April Inflation More than Double FED Target
- Managing Business During Periods of Inflation
- March Inflation Skyrockets
- A Stock Pickers Guide To Thinking About Inflation
- How Inflation Can Effect Rising Prices
- Inflation Adjusted Crude Oil Prices (updated)
From UnemploymentData.com.
- May Unemployment Down
- What Qualities Do You Need for a Career in Political Marketing?
- Breathing Easier: How to Increase Safety in a Building With Asbestos
- Considering Starting a Salon Business?
- April Unemployment Report “Disappointing”
- Signs You Need to Upgrade Your Business Equipment
From Financial Trend Forecaster
- Online Stockbrokers Going Public
- Aspiring Investors: Getting Started in the Stock Market
- Common Mistakes When Trading Penny Stocks
- Cisco Systems Stock is on the Move in April
- Why These Stock Market Indicators Should Grab Your Full Attention
- Ripple the Cryptocurrency of Banks
From Elliott Wave University
- Elliott Wave Analysis Can Help You See Countertrends. Pattern in Focus: the Zigzag.
- Capital Gains Tax Hike News: Was It REALLY to Blame for Sell-off?
- Rise of the “Know Nothings”
- Are Investors “Courting Doom”?
- Too Many Bulls?
From OptioMoney.com
- Downsizing Mistakes People Make in Retirement
- The Complete Guide to Selling Rental Property
- 4 Things to Know Before Buying Car Insurance
- Tips in Buying a Home for Retirement
- Best Real Estate Investments for First-Timers
- Downsizing to Pay Off a Mortgage – Is it a Good Idea?
- Teach Your Kids to Budget Money Effectively
From Your Family Finances
- Keeping Remodeling Costs Down
- Home Repair Costs: How Homeowners Keep Their Pocketbook Balanced
- When Should You Replace Your Furnace?
- Home Renovations Before Selling
- Ways to Diversify Your Family’s Investments
- How To Negotiate When Buying a Home
- Growing Family: How to Set up Your Finances for a New Home
- Avoid These Investing Mistakes

Leave a Reply