
The U.S. Bureau of Labor Statistics (BLS) released the monthly and annual Inflation numbers for April 2017.
- Annual inflation was 2.20% down from 2.38% in March, 2.74% in February, and 2.50% in January but above the 2.07% in December.
- Consumer Price Index (CPI-U) 244.524 up from 243.801 in March
- Monthly Inflation for April was 0.30% very close to February’s 0.31% and similar to the average between March’s 0.08% and January’s 0.58%.
- Next release June 14th
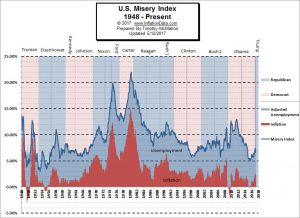 With Inflation falling almost 2/10ths of a percent and unemployment down one-tenth of a percent the Misery Index is down 3/10ths of a percent. The misery index helps determine how the average citizen is doing economically and it is calculated by simply adding the Annual inflation rate to the Seasonally Adjusted unemployment rate.
The misery index as of May 2017 (based on the most recent official government data for the 12 months ending in April) is at 6.60% (4.4% unemployment and 2.20% inflation) down from last month’s 6.88% and 7.44% in February and well below the peak of 12.87% in both October and November 2011 which was pretty miserable. With inflation and unemployment down for the month, the Misery index is down 0.28% in one month and whopping 0.84% in two months. See the Misery Index for more info.
Inflation Protected Annuities
Rising inflation can prove problematic for investors as investment returns are unable to keep pace with rising prices. More so for retirees, who fear investing as they lose purchasing power during this economic phase.
A recent study by LIMRA revealed that when inflation reaches 3%, retirees may see their purchasing power drop by over $117,000 in more than a 20-year period. In fact, even at 2%, the impact of inflation creates a shortfall of about $74,000.
“Seniors or retirees face a different inflation environment than nonretirees,” said Matthew Drinkwater, an assistant vice president at the institute who participated in the research. As a result, inflation becomes one of the top things people fear most upon retirement.
Therefore, buying an inflation-protected annuity may offer an opportunity to avoid the effects of inflation while safeguarding your retirement outlook. Read More…

The History of Our Monetary System
Although it is probably too small for you to read, the inscription below the image in the center of this early Delaware Currency says “to counterfeit is death” too bad that doesn’t apply when the government is doing the excess printing.
Our early forefathers knew the dangers of printing too much currency as they suffered under massive inflation of the first national currency called the “Continental”. This inflation resulted in a famous saying circulating “not worth a Continental”. Interestingly, Pennsylvania was unique in that it did not issue more currency than it could redeem and it remains one of the few examples in history of a successful government-managed monetary system. Pennsylvania’s paper currency, secured by land, was said to have generally maintained its value against gold from 1723 until the Revolution broke out in 1775. Read more…
For More History See:
- Oil, Petrodollars and Gold
- Gold and Inflation
- Inflation and the Civil War
- Keynesian vs Austrian Economics
- The History of Gold as Money in the U.S.
 Current Annual Inflation Commentary
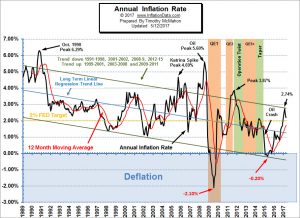
For a while now we have been saying not to be fooled by the rising inflation rates it was quite possible that it was just a cyclical move to the top of the channel. And now it looks like the peak was exactly at the top of the channel and we have now had two down months in a row with the possibility that when we see May’s numbers next month annual inflation will be below 2%.
Current NYSE-ROC Analysis:
Hold Signal! Index nears Moving Average.
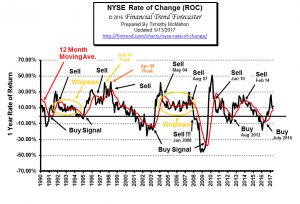 A buy signal was generated in July 2016. In April 2017 we switched to a HOLD signal as the ROC has peaked and nears its moving average.
This month the monthly rate of return was 2.11% after being negative last month. The annual rate of return rose from 9.32%% last month to 11.92% this month. We saw a peak last month after shooting up from below zero so we would expect it to drop through the moving average shortly. If it enters a whipsaw pattern bouncing around 10% like it has in the past (1992-1995) and (2004-2008) the market will be very happy indeed. If it follows the pattern of “recovery” like 2014-2016 not so much. For more information see the NYSE ROC.
NASDAQ Rate of Change (ROC)©
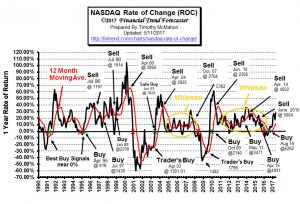 Last month the NASDAQ index fell 0.88% since then the NASDAQ has rallied with a vengeance gaining 5.36% bringing Annual returns up to the 28% level.
It remains well above its moving average thus maintaining a buy signal, but it has faltered thus making us a bit cautious thus the “hold” signal.
The Moore Inflation Predictor
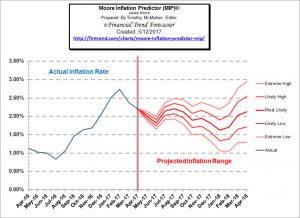 This month, the MIP is projecting that May should be much more moderate than April. So we are expecting another decrease in Annual inflation possibly dipping below 2% for May and then going even lower for June.
See the Moore Inflation Forecast.
You might also like:
- Low Probability Market Will Crash
- Big Oil Betting On Electric Vehicles?
- Futuristic Advances to Ancient Materials
- Investors Pessimistic… Market to Rally
- Only 25% Intend to Retire at Retirement Age
- Over a Million New Jobs Not 211,000
- Are Defensive Assets Waving Red Flags For Stocks?
- This indicator had a divergence in both 2000 and 2007; a divergence is also present in 2017
- Robert Prechter Talks About Elliott Waves and His New Book
- How Concerning Is The S&P 500’s Pullback?
- Personal Finance Strategy: 4 Keys to Avoiding Bankruptcy
- How Do Newly Divorced Individuals Determine Alimony and Child Support
- Six Tax Break Tricks for New Homeowners
- Money & Mannerisms: Traits That Lead to Success
- A Fresh Start: 4 Reasons Bankruptcy Is Not As Bad As You Think
- How Much Mortgage Can You Really Afford
- Why We Downsized Before Retirement
- Top Vacation Articles

Leave a Reply