• Home
  • Related Sites
    • Financial Trend Forecaster
      • Moore Inflation Predictor
      • NYSE Rate of Change (ROC)
      • NASDAQ Rate of Change (ROC)
      • Crypto ROC- BTC & ETH
    • Unemployment Data
      • Historical Employment Data
      • Unemployment Rate Chart
      • Labor Force Participation Rate
    • Optio Money
    • Elliott Wave University
    • More Resources
  • Definitions
    • What is Inflation?
    • What is Core Inflation?
    • Inflation vs CPI
    • What is Deflation?
    • What is Disinflation?
    • What is Agflation?
    • What is Stagflation?
    • What is Hyperinflation?
    • What is Quantitative Easing?
    • What is Quantitative Tightening?
    • What is Velocity of Money?
    • What is Fiat Currency?
    • How Do I Calculate Inflation?
    • What are “Sticky Prices” and Why Do They Matter?
  • Featured Content
  • About Us
  • Feedback
    • Sitemap
  • Subscribe Now

InflationData.com

Your Place in Cyber Space for Inflation Data

CPIWidget-Feb26
  • Numerical Inflation Data
    • Current Inflation Rate
    • Monthly Inflation Rate (Moved)
    • Historical U.S. Inflation Rates
    • Historical CPI
  • Inflation Charts
    • Ann. Inf. Rate Chart
    • Long Term Inflation >
      • Ave. Inf. by Decade
      • Total Inf. by Decade
      • Inflation 1913-1919
      • Inflation 1920-1929
      • Inflation 1930-1939
      • Inflation 1940-1949
      • Inflation 1950-1959
      • Inflation 1960-1969
      • Inflation 1970-1979
    • Cumulative Inflation
    • FED Monetary Policy and Inflation
    • Inflation and Recession
    • Confederate Inflation (1861 – 1865)
    • Misery Index
    • The 3 Stages of Inflation
    • 15-Yr Inflation Trends Chart
  • Inflation Calculators
    • Cumulative Inf. Calc.
    • How Much Would it Cost
    • Salary Inf. Calc.
    • Cost of Living Calc.
    • U.K. Inf. Calc.
    • Cost of Gas Calc.
    • Net Worth Calc.
    • Lifetime Earnings Calc.
    • Savings Goal Calc.
    • Financial Calculators
  • Inf. Adjusted Prices
    • Energy >
      • Inflation Adj. Gas Prices
      • Historical Oil Prices Chart
      • Crude Oil Price (Table)
      • Natural Gas Prices
      • Electricity Prices
      • Oil vs Gold
    • Gold >
      • Inflation Adjusted Annual Average Gold Prices
      • Gold is a “Crisis Hedge” not an  “Inflation Hedge”
      • Comparing Oil vs. Gold
    • Corn Prices
    • Education Inflation
    • Housing Prices
    • Mortgage Rates
    • NYSE Index
    • Inf. Indexed Bonds
    • Movie Revenues
    • Inflation-Adjusted Wages
  • Cost of Living
    • Calculate Cost of Living
    • Cost-of-living Adj. (COLA)
    • Consumer Price Index CPI
      • Historical CPI
      • Current CPI
      • CPI Release Dates
    • Gas Prices >
      • Cost of Gas
      • Cost of Gas Per Month
      • Gas vs. Oil Price Chart
    • Food Prices 1913 vs 2013
    • Health Insurance
  • Blog
    • Key Inflation Articles
    • International Inflation
    • Historical Inflation Rates for Japan (1971 to 2014)
You are here: Home » 2022

Annual Inflation Retreats in October

Published on November 11, 2022 by Tim McMahon Leave a Comment

Annual Inflation Rate 2010 - Oct 2022

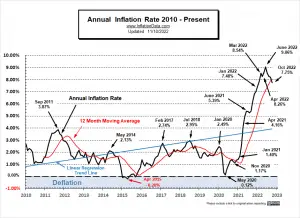
The Bureau of Labor Statistics reported that Annual Inflation for October 2022,  fell from 8.20% to 7.75% Monthly inflation at 0.41% was still very high for a month in the fourth quarter, which is traditionally negative or at least very close to zero. But although high, October 2022 monthly inflation was still lower than in October 2021. So… Annual inflation for the 12 months ending in October 2022 fell to 7.75%. This was down from 8.20% in September 2022. Inflation Summary: Annual Inflation fell from 8.20% to 7.75% CPI Index rose from 296.808 to 298.012 Monthly Inflation for October was 0.41% Next release is December 13th October Annual Inflation was 7.75%. Jan. … [Read more...]

Filed Under: Inflation Tagged With: 2022, CPI, inflation, NASDAQ, NYSE, October

March Inflation Highest Since 1981

Published on April 13, 2022 Updated on April 26, 2022 by Tim McMahon Leave a Comment

Monthly Inflation 2019- Mar 2022

The Bureau of Labor Statistics reported that in March 2022 Inflation Hit 8.5% Inflation Summary: Annual Inflation is the highest since December 1981. CPI Index rose from 283.716 to 287.504. Monthly Inflation for March was 1.34% up from February's 0.91% The next release is on May 11th March 2022 Annual Inflation was 8.54%. Jan. 2021 -- 1.40% ** Jan. 2022 -- 7.48% ** Feb. 2022 -- 7.87% Higher Gasoline prices pushed inflation to new heights in March 2022. The last time inflation was higher was in December 1981 when it was 8.92% but then it was declining from the March 1980 peak of 14.76%. Although we calculate it to two decimal places the Bureau of Labor Statistics … [Read more...]

Filed Under: Inflation Tagged With: 2022, BLS, Bureau of Labor Statistics, March Inflation

February 2022 Inflation- 7.9%… Is 11% Next?

Published on March 10, 2022 by Tim McMahon Leave a Comment

Inflation Prediction

The Bureau of Labor Statistics reports February 2022 Inflation Hits Another Record High. Inflation Summary: Annual Inflation highest since January 1982. CPI Index rose from 281.148 to 283.716. Monthly Inflation for February was 0.91% The next release is on April 12th February 2022 Annual Inflation was 7.87%. Jan. 2021 -- 1.40% ** Jan. 2022 -- 7.48% ** Feb. 2022 -- 7.87% Inflation soared again in February 2022. The last time inflation was higher was in January 1982 when it was 8.39% but then it was declining from the March 1980 peak of 14.76%. Although we calculate it to two decimal places the Bureau of Labor Statistics reported February's inflation rate as 7.9%. BLS … [Read more...]

Filed Under: Uncategorized Tagged With: 2022, February, gasoline, inflation

Latest Posts

  • BLS Inflation Data Delayed
  • Updated Cumulative Inflation Calculator
  • Inflation-Adjusted Silver Prices
  • December Inflation Down Slightly, Not Flat
  • December 2025 Inflation Report for November
  • How Deflation Created the Middle Class
  • October Inflation Numbers Delayed
  • Why the 2.8% COLA May Fall Short of Real Inflation

Sponsored:

As a Seasoned Investor I thought I'd seen everything... But recently I discovered TradingView which has really improved the information I have at my fingertips.~ Tim McMahon, editor

TradingView gives me an edge... including powerful charting tools, real-time market data, and a global community of traders—all in one easy to use platform. It has hundreds of indicators, and even custom scripts for more advanced users, and you don't need to change Brokers just use its seamless brokerage integration... TradingView isn't just a charting tool—it's your full trading command center.

Trade smarter. Trade faster. Check Out TradingView for free.

----------

The Best Place to Buy Your Crypto

Coinbase is the largest Crypto Trading platform in the U.S. and the easiest to use. ~Tim McMahon, editor

Check out Coinbase here

Subscribe Now

eTrends Signup Form

Elliott Wave Resources

Free Elliott Wave Resources

What is Waveopedia?

Waveopedia is EWI’s free, comprehensive index of Elliott wave patterns and terms. Everyone from beginners to experts can benefit from it. It’s a great place to send your followers if they’re new to Elliott waves.

  • Deflation Hits China is the U.S. Next?

  • Why You Must Avoid the Herding Trap

  • Chasing Trends Can Cost You

  • More Education Resources

Post Archives

Home | Articles | Sitemap | Terms of Service | Privacy | Disclaimer | Advertise With Us

Copyright © 1996-2026 · Capital Professional Services, LLC · Maintained by Design Synergy Studio · Admin

Do Not Sell My Personal Information