• Home
  • Related Sites
    • Financial Trend Forecaster
      • Moore Inflation Predictor
      • NYSE Rate of Change (ROC)
      • NASDAQ Rate of Change (ROC)
      • Crypto ROC- BTC & ETH
    • Unemployment Data
      • Historical Employment Data
      • Unemployment Rate Chart
      • Labor Force Participation Rate
    • Optio Money
    • Elliott Wave University
    • More Resources
  • Definitions
    • What is Inflation?
    • What is Core Inflation?
    • Inflation vs CPI
    • What is Deflation?
    • What is Disinflation?
    • What is Agflation?
    • What is Stagflation?
    • What is Hyperinflation?
    • What is Quantitative Easing?
    • What is Quantitative Tightening?
    • What is Velocity of Money?
    • What is Fiat Currency?
    • How Do I Calculate Inflation?
    • What are “Sticky Prices” and Why Do They Matter?
  • Featured Content
  • About Us
  • Feedback
    • Sitemap
  • Subscribe Now

InflationData.com

Your Place in Cyber Space for Inflation Data

CPIWidget-Jan26
  • Numerical Inflation Data
    • Current Inflation Rate
    • Monthly Inflation Rate (Moved)
    • Historical U.S. Inflation Rates
    • Historical CPI
  • Inflation Charts
    • Ann. Inf. Rate Chart
    • Long Term Inflation >
      • Ave. Inf. by Decade
      • Total Inf. by Decade
      • Inflation 1913-1919
      • Inflation 1920-1929
      • Inflation 1930-1939
      • Inflation 1940-1949
      • Inflation 1950-1959
      • Inflation 1960-1969
      • Inflation 1970-1979
    • Cumulative Inflation
    • FED Monetary Policy and Inflation
    • Inflation and Recession
    • Confederate Inflation (1861 – 1865)
    • Misery Index
    • The 3 Stages of Inflation
    • 15-Yr Inflation Trends Chart
  • Inflation Calculators
    • Cumulative Inf. Calc.
    • How Much Would it Cost
    • Salary Inf. Calc.
    • Cost of Living Calc.
    • U.K. Inf. Calc.
    • Cost of Gas Calc.
    • Net Worth Calc.
    • Lifetime Earnings Calc.
    • Savings Goal Calc.
    • Financial Calculators
  • Inf. Adjusted Prices
    • Energy >
      • Inflation Adj. Gas Prices
      • Historical Oil Prices Chart
      • Crude Oil Price (Table)
      • Natural Gas Prices
      • Electricity Prices
      • Oil vs Gold
    • Gold >
      • Inflation Adjusted Annual Average Gold Prices
      • Gold is a “Crisis Hedge” not an  “Inflation Hedge”
      • Comparing Oil vs. Gold
    • Corn Prices
    • Education Inflation
    • Housing Prices
    • Mortgage Rates
    • NYSE Index
    • Inf. Indexed Bonds
    • Movie Revenues
    • Inflation-Adjusted Wages
  • Cost of Living
    • Calculate Cost of Living
    • Cost-of-living Adj. (COLA)
    • Consumer Price Index CPI
      • Historical CPI
      • Current CPI
      • CPI Release Dates
    • Gas Prices >
      • Cost of Gas
      • Cost of Gas Per Month
      • Gas vs. Oil Price Chart
    • Food Prices 1913 vs 2013
    • Health Insurance
  • Blog
    • Key Inflation Articles
    • International Inflation
    • Historical Inflation Rates for Japan (1971 to 2014)
You are here: Home » stocks

4 Key Factors to Consider When Hedging Against Inflation

Published on April 19, 2024 Updated on May 31, 2024 by Guest Author Leave a Comment

Hedging Against Inflation gold, stocks, real estate

The FED's target yearly inflation rate in the U.S. is about 2%, but the long term average is more like 3% and depending on ongoing economic conditions, this rate can significantly increase, affecting the financial health of individuals across the country. Though keeping an eye on the economy can help you make decisions to brace against the impact of inflation, developing sound investments can help you protect your wealth no matter the rate. Take a look below for a few central items to consider when preserving your finances against inflation.  Diversify your Portfolio Portfolio diversification is crucial for maintaining optimal financial health. Your investments should vary in asset class … [Read more...]

Filed Under: Inflation Tagged With: gold, Hedging Against Inflation, real estate, stocks

Inflation Falls Again in December

Published on January 14, 2023 by Tim McMahon Leave a Comment

Annual Inflation Rate 2010- Dec 2022

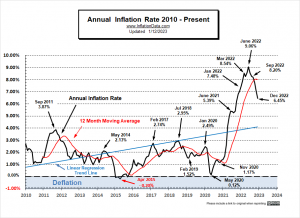
The Bureau of Labor Statistics reported that Annual Inflation fell from 7.11% in November to 6.45% in December 2022. This was down from a peak of  9.06% in June 2022. Monthly inflation was negative (Disinflation) for November at -0.10% and December at -0.31%. This is fairly typical for the fourth quarter, which is traditionally negative. Monthly inflation for 2022 was lower than in November 2021, so December Annual inflation fell. It is important to remember that although the inflation RATE is falling... prices are still going up, i.e., prices are still 6.5% higher than they were a year ago.  A decline from 7.5% to 6.5% is similar to a car going from 75 mph to 65 mph... it is still … [Read more...]

Filed Under: Inflation Tagged With: BLS, December 2022, inflation, stocks

Analyzing 5 Ways You Can Hedge Against Surging Inflation

Published on May 17, 2022 by Tim McMahon Leave a Comment

Stocks for Inflation Hedging

Inflation in the U.S. has reached levels not seen since the 1980s. That means that millennials have never seen inflation this high. Consequently, they are probably unaware of not only how devasting inflation can be, but also about the best ways to hedge against surging inflation. Simply stated, inflation ravages purchasing power, and the higher the inflation rate, the quicker purchasing power is destroyed. Even if you receive a cost of living (CoL) raise it is usually "too little too late" just like the FED's recent attempts to fight inflation. The reason a CoL raise doesn't help much is because it is a lagging entity. In other words, even if you get a raise equal to the actual level of … [Read more...]

Filed Under: Hedging Tagged With: diversification, gold, Hedging, real estate, Stock up, stocks, Surging Inflation

Gold as an Investment

Published on January 15, 2019 Updated on August 30, 2019 by Tim McMahon Leave a Comment

Gold Stock Correlation

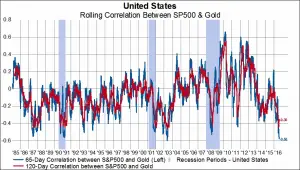
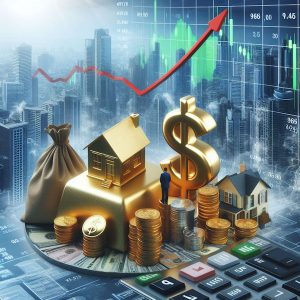
The main idea behind investment is to grow and preserve wealth, and in many cases, find unique ways to generate more income. Popular wisdom has it that when interest rates rise gold prices fall because the opportunity cost of holding a non-interest bearing asset is growing. However, contrary to popular wisdom, recent interest rate hikes by the US Federal Reserve have coincided with a rising gold price. At the same time, investor confidence in the stock market is faltering due to the FED's actions. Thus many investors can be seen rushing to the financial security offered by safe-haven assets such as gold.   Rising Interest Rates Quantitative Tightening This is why gold … [Read more...]

Filed Under: Gold Tagged With: correlation, gold, inflation, stocks

July CPI Down But Inflation Up

Published on August 12, 2017 Updated on March 31, 2021 by Tim McMahon Leave a Comment

Annual Inflation Chart

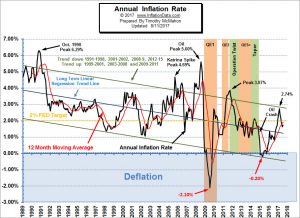
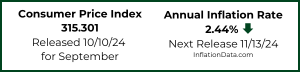
The Bureau of Labor Statistics Released the Inflation Data for the Year ending in July on August 11th. Annual inflation was 1.73% in July - Up from 1.63% in June, but down from 1.87% in May, 2.20% in April,  2.38% in March, 2.74% in February, and  2.50% in January. CPI 244.786 in July down from CPI 244.955 in June Monthly Inflation for July -0.07%,  June 0.09%, May 0.09%, April was 0.30%, March was 0.08%, February was 0.31% and 0.58% in January. Next release September 14th The reason the CPI went down but inflation went up is because July 2016 monthly inflation was -0.16% and this July was less negative. So CPI goes down for the month but not as much as last year so Annual … [Read more...]

Filed Under: Consumer Price Index Articles Tagged With: CPI, inflation, MIP, NASDAQ, NYSE, ROC, stocks

The Impact of Inflation on Savings

Published on February 5, 2013 Updated on February 24, 2014 by Tim McMahon 3 Comments

Inflation Savings

The obvious impact of inflation on your savings is that the purchasing power is erroded. This means that if you stash $100 under the mattress today and inflation is 3% per year when you come back a year from now your $100 will buy 3% less stuff. Put another way you would need $103 to buy the same amount of goods a year later. When you extend this to 10 years you might think that it would mean that you would need $130 to buy the same amount of goods but because of the effects of compounding you would actually need $134.39. You can use the Retirement Planning Calculator to calculate the impact of inflation on your savings. As time goes on the impact of "only" 3% inflation compounds making … [Read more...]

Filed Under: Inflation, Precious Metals, Stock Market Tagged With: bonds, gold, inflation, Saving, silver, stocks

Inflation Adjusted Gold vs Stocks vs Bonds

Published on March 23, 2012 Updated on September 17, 2024 by Tim McMahon 6 Comments

Recently our good friends at Casey research published the following chart comparing the inflation adjusted Gold returns to stocks and bonds for the period 1971 through the present.  From this chart we can see that as bonds fell during the late 1970's gold rose equivalently and stocks were basically flat. During the 1980's bonds rose and gold fell while while stocks rose slightly. During the 1990's stocks rose sharply gold fell and Bonds were volatile but basically flat to slightly up. During the 2000's gold was up sharply, stocks were volatile and bonds were pretty flat. … [Read more...]

Filed Under: Bonds, Gold, Inflation, Stock Market Tagged With: bonds, Buffett, gold, Graham, modern portfolio theory, stocks, value investing

Get Your Free Report: How to Use Bar Patterns to Spot Trade Setups

Published on October 9, 2010 Updated on February 17, 2014 by Tim McMahon Leave a Comment

Greetings reader, Our friends at Elliott Wave International, the world’s largest market forecasting firm, have just updated their free report, How to Use Bar Patterns to Spot Trade Setups. With thousands of downloads, “Bar Patterns” has always been a huge hit with traders. But now it’s been packed with even more ways you can use common bar patterns to spot high-probability trading opportunities: 30 charts across 15 pages! Don’t miss out on this opportunity to learn simple new ways to spot valuable trade setups in the charts you view every day. Download Your Free Bar Patterns Report. … [Read more...]

Filed Under: Free Resources Tagged With: bar pattern trading, stock market, stocks, trading

Free Candle Stick Guides

Published on September 10, 2010 Updated on February 17, 2014 by Tim McMahon Leave a Comment

If you are a trader and not using candlestick charts, you are missing a lot of profitable trades. So here are a couple of Free Resources to get you started. Free Candlestick Reversal Pattern Guide Basic Candlestick Momentum analysis Report   … [Read more...]

Filed Under: Free Resources Tagged With: candlestick charting, Free, stock market, stocks, trading

Latest Posts

  • Updated Cumulative Inflation Calculator
  • Inflation-Adjusted Silver Prices
  • December Inflation Down Slightly, Not Flat
  • December 2025 Inflation Report for November
  • How Deflation Created the Middle Class
  • October Inflation Numbers Delayed
  • Why the 2.8% COLA May Fall Short of Real Inflation
  • Delayed BLS September Inflation Data Released

Sponsored:

As a Seasoned Investor I thought I'd seen everything... But recently I discovered TradingView which has really improved the information I have at my fingertips.~ Tim McMahon, editor

TradingView gives me an edge... including powerful charting tools, real-time market data, and a global community of traders—all in one easy to use platform. It has hundreds of indicators, and even custom scripts for more advanced users, and you don't need to change Brokers just use its seamless brokerage integration... TradingView isn't just a charting tool—it's your full trading command center.

Trade smarter. Trade faster. Check Out TradingView for free.

----------

The Best Place to Buy Your Crypto

Coinbase is the largest Crypto Trading platform in the U.S. and the easiest to use. ~Tim McMahon, editor

Check out Coinbase here

Subscribe Now

eTrends Signup Form

Elliott Wave Resources

Free Elliott Wave Resources

What is Waveopedia?

Waveopedia is EWI’s free, comprehensive index of Elliott wave patterns and terms. Everyone from beginners to experts can benefit from it. It’s a great place to send your followers if they’re new to Elliott waves.

  • Deflation Hits China is the U.S. Next?

  • Why You Must Avoid the Herding Trap

  • Chasing Trends Can Cost You

  • More Education Resources

Post Archives

Home | Articles | Sitemap | Terms of Service | Privacy | Disclaimer | Advertise With Us

Copyright © 1996-2026 · Capital Professional Services, LLC · Maintained by Design Synergy Studio · Admin

Do Not Sell My Personal Information