
The U.S. Bureau of Labor Statistics released its May Inflation report on June 12th showing Annual Inflation was down from 3.4% in April to 3.3% in May.
(But since we calculate it to two digits, it was actually 3.36% in April and 3.27% in May.) On a Seasonally adjusted basis, monthly inflation in May was ZERO. Bloomberg is making a big deal about that, but what does it really mean? As, I’ve been saying, beginning in the May-June timeframe inflation typically moderates for the Summer months and then gets really low (or even negative) in the 4th quarter. And that is what is happening.
Double Whammy Day
The overnight markets were down expecting more inflation so when the report was released Mr. Market took this as a good sign and rallied. But then later in the day, the FED reported that they would probably only have one rate cut this year. So the market gave back most of its gains.
(Here’s a secret for you: Despite what the market thinks, the FED may not have any rate cuts this year. Why? Because by the time they are ready to cut rates, i.e., around September, it will be election season, and the optics of a rate cut would make them look partisan.)
Although, it is possible that with enough foreshadowing they will do the cut and say, see we told you it was coming. But it is equally likely that they may not. In addition, the 4th quarter typically is disinflationary so… Why would the FED cut rates when inflation will be moderating further anyway?
Unadjusted monthly inflation was 0.65% in March which moderated sharply to “only” 0.39% in April and then fell to 0.17% in May.
May 2023 was 0.25% so replacing that with 0.17% resulted in a small decline.
June 2023 was 0.32% so if we get another 0.17% month inflation will fall even further.
The actual decrease was at the low end of our projected range, i.e., just above our “Extreme low” number of 3.25%, indicating that inflation is moderating.
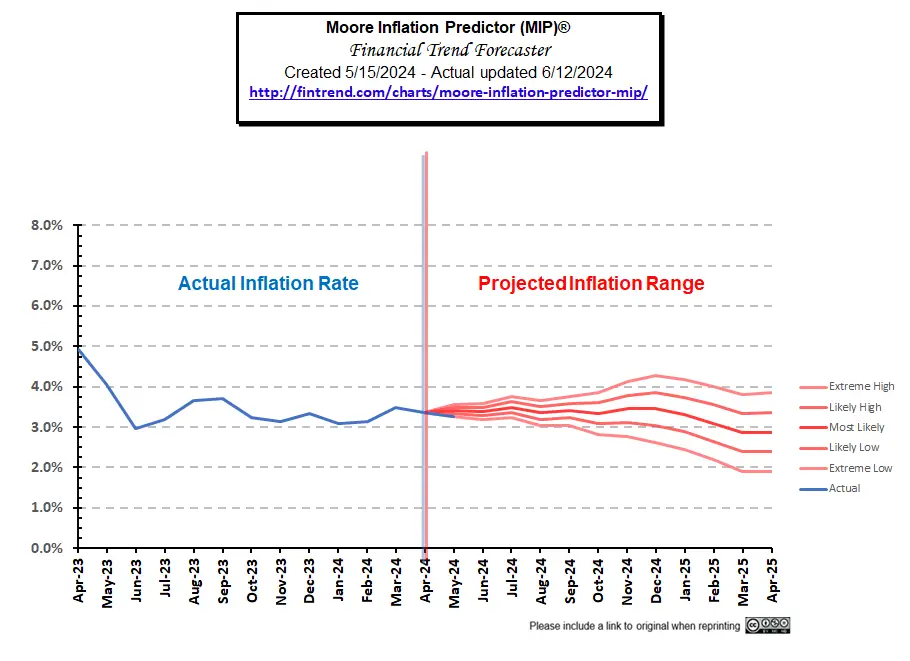 Go here to view our current MIP projection.
May 2024 Inflation Summary:
- Annual Inflation fell from 3.36% to 3.27%
- CPI Index rose from 313.548 to 314.069
- Monthly Inflation for May was 0.17%
- Next release July 11th 2024
| Jan | Feb | Mar | Apr | May | June | July | Aug | Sep | Oct | Nov | Dec | |
| 2022 | 7.48% | 7.87% | 8.54% | 8.26% | 8.58% | 9.06% | 8.52% | 8.26% | 8.20% | 7.75% | 7.11% | 6.45% |
| 2023 | 6.41% | 6.04% | 4.98% | 4.93% | 4.05% | 2.97% | 3.18% | 3.67% | 3.70% | 3.24% | 3.14% | 3.35% |
| 2024 | 3.09% | 3.15% | 3.48% | 3.36% | 3.27% |
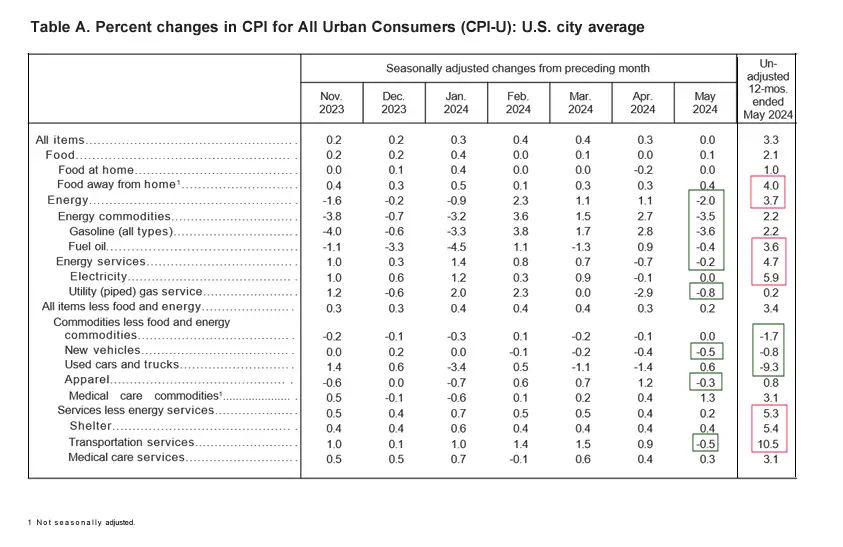
BLS Commentary:
The BLS Commissioner reported:
“The Consumer Price Index for All Urban Consumers (CPI-U) was unchanged in May on a seasonally adjusted basis, after rising 0.3 percent in April, the U.S. Bureau of Labor Statistics reported today. Over the last 12 months, the all items index increased 3.3 percent before seasonal adjustment. More than offsetting a decline in gasoline, the index for shelter rose in May, up 0.4 percent for the fourth consecutive month. The index for food increased 0.1 percent in May. The food away from home index rose 0.4 percent over the month, while the food at home index was unchanged. The energy index fell 2.0 percent over the month, led by a 3.6-percent decrease in the gasoline index.”
Looking at Table A below we can see that on an annual basis, energy is no longer down, but on a monthly basis it is down fairly significantly. Here is where we also see the Seasonally Adjusted monthly ZERO both under “All Items” and also for “Food at home” and Commodities less food and energy.
Although these “Seasonally Adjusted” numbers are slightly different than those presented by the BLS, the following chart from the Federal Reserve shows the gap between inflation with and without Food and Energy. Comparing the two we can see how much food and energy contribute toward overall inflation.
If the blue line is above the red line, food and energy, add to the overall inflation rate. But if blue is below the red line, they are actually mitigating overall inflation. As the blue line rose toward the red line from June through August, we noted that energy was doing less to keep down overall inflation. But in October through January gas prices were falling helping to drag down overall inflation.
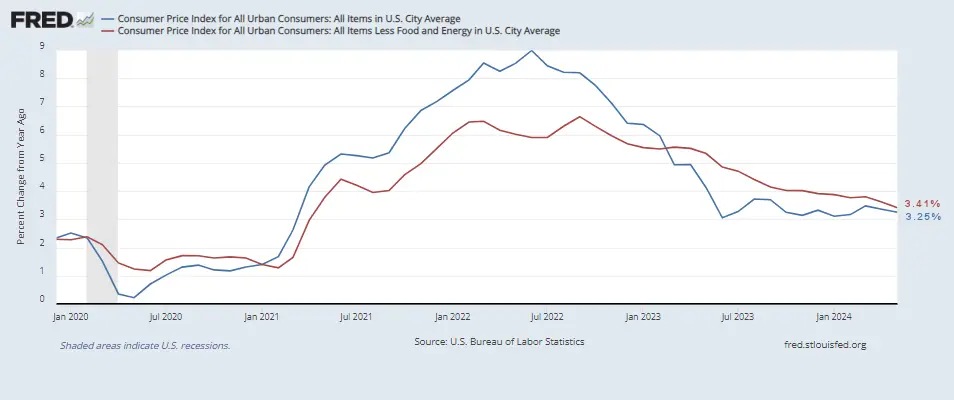
Source: St. Louis FED
M2 Money Supply
Looking at the M2 money supply we get a slightly different picture.
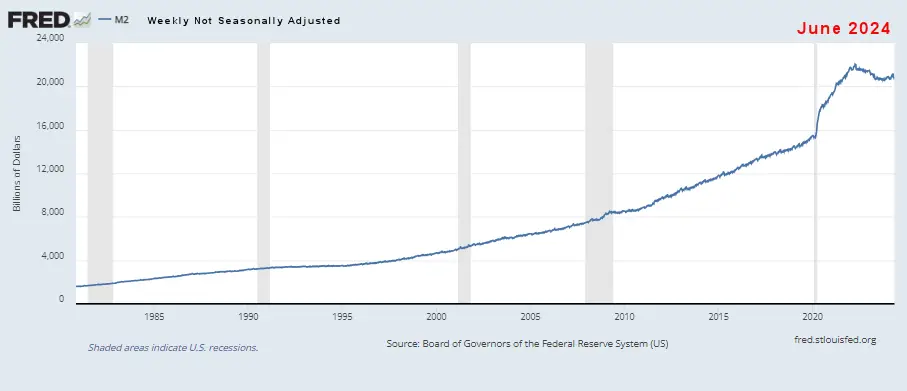
Here we see a steady growth of the money supply from 2009 through 2020 then a sharp spike as we saw with FED assets and then a slightly less sharp incline (but longer duration) taking M2 to 22 Trillion dollars in 2022. From 2022 to 2023 we see the decline we would expect due to the reduction of FED assets… BUT rather than continuing to decline in 2023 as FED assets do, M2 levels out and despite FED assets declining in 2024 M2 actually shows a bit of an uptick. This could be the reason for the rebound in the stock market, beginning at about the same time as this uptick in M2. Not surprisingly, this is just in time to boost the market for the November election.
Typically, the FED tries to keep things as steady as possible during an election year, to avoid the appearance of partiality. But as we noted in the NYSE ROC commentary, the M2 money supply is increasing despite FED assets declining. This could be a stealth move to boost the market (and help Biden) just in time for the election. Rumor has it that FED chairman Jerome Powell doesn’t like Trump… primarily, I believe, because Trump has tried to reign in the FED’s money-printing ability and return to a quasi-gold standard.
Energy Prices
Overall energy prices have been down over the last year because the government was flooding the market with cheap oil by depleting our strategic petroleum reserves. But at some point, they have to replace those reserves (perhaps at much higher prices). Note: Reserves would have started at much higher levels had Democrats not refused Trump’s request to increase reserves when oil was cheap.
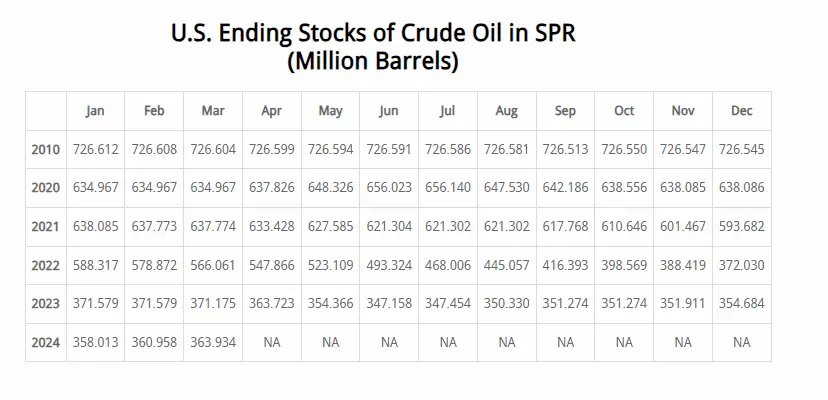
This chart from the U.S. EIA shows the extent of the recent strategic petroleum reserve drawdown compared to those of Desert Storm, various hurricanes, and other supply disruptions. Unfortunately, the E.I.A. is always a couple of months behind in updating its chart. But with the data we have we can see that the recent draw-down dwarfs all of the others combined. In July 2020, the SPR stood at 656,140,000 barrels. It has started to tick up in the last few months.
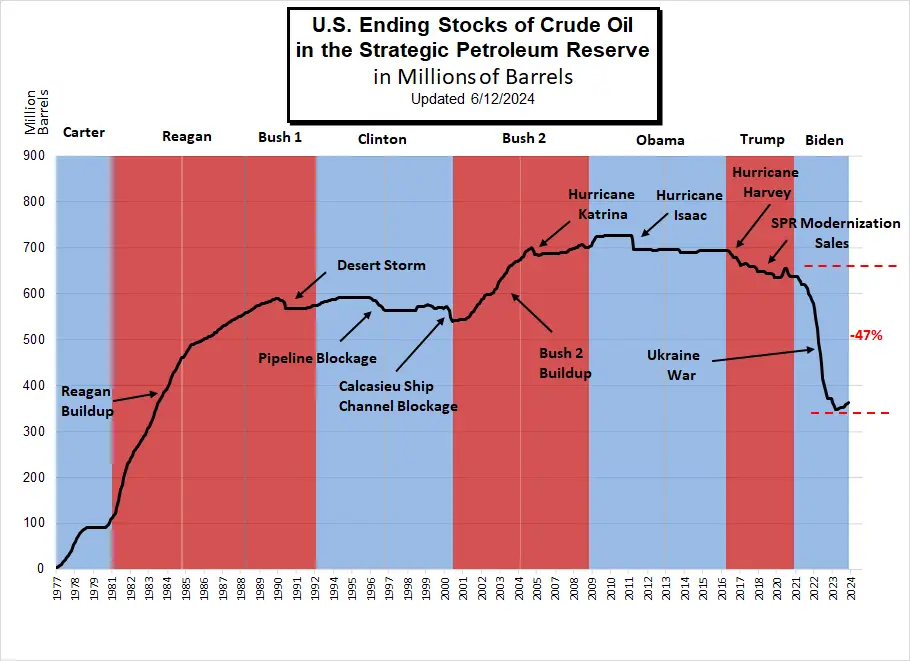 Note: Section 404 of the Bipartisan Budget Act of 2015 authorizes the Secretary of Energy to draw down and sell up to $2 billion of SPR crude oil, for fiscal years (FY) 2017 through 2020, to carry out an SPR modernization program.
EIA Data History of SPR Releases
Inflation Chart
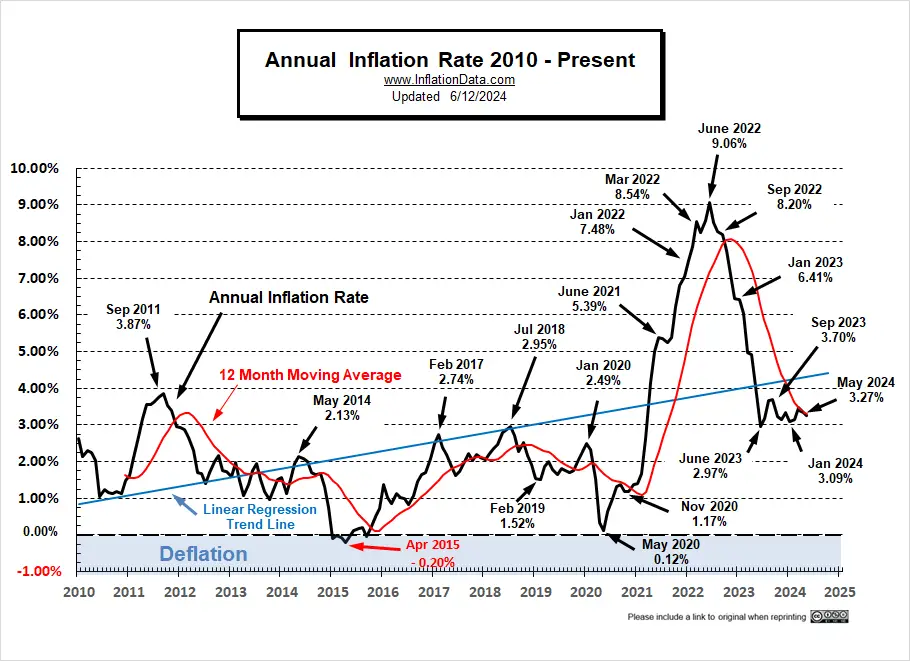
Monthly Inflation Compared to Previous Years:
The monthly inflation rate for May 2024 was 0.17%.
In the chart below, we can see how the UNADJUSTED monthly inflation compares between 2018 (light green), 2019 (light blue), 2020 (pink), 2021 (purple), 2022 (orange), 2023 (dark), 2024 (teal). Interestingly, January 2018 and January 2024 are identical. From this Chart, we can see, that April 2024’s 0.39% is lower than April 2023’s 0.51% and May 2024’s 0.17% is lower than 2023’s 0.25%.
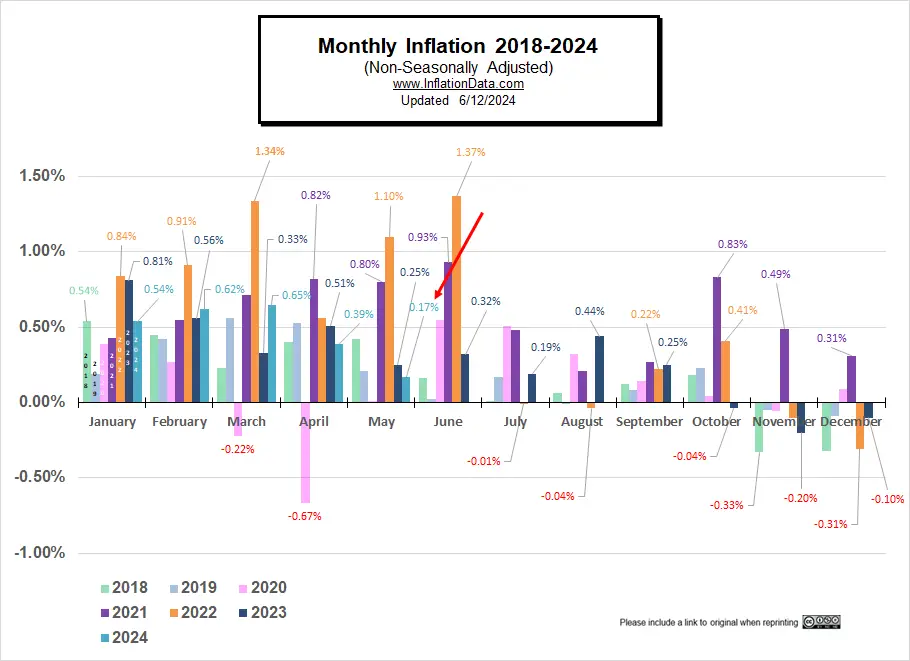
Not Seasonally Adjusted Monthly Inflation Rates
Note: January 2022’s 0.84% was the highest January since 1990. June was the highest June since 1941 (although the first quarter of 1980 had some higher rates). Typically, the first quarter has the highest monthly inflation and the 4th quarter is the lowest (even negative).
| Jan | Feb | Mar | Apr | May | Jun | Jul | Aug | Sep | Oct | Nov | Dec | |
| 2016 | 0.17% | 0.08% | 0.43% | 0.47% | 0.41% | 0.33% | (0.16%) | 0.09% | 0.24% | 0.12% | (0.16%) | 0.03% |
| 2017 | 0.58% | 0.31% | 0.08% | 0.30% | 0.09% | 0.09% | (0.07%) | 0.30% | 0.53% | (0.06%) | 0.002% | (0.06%) |
| 2018 | 0.54% | 0.45% | 0.23% | 0.40% | 0.42% | 0.16% | 0.01% | 0.06% | 0.12% | 0.18% | (0.33%) | (0.32%) |
| 2019 | 0.19% | 0.42% | 0.56% | 0.53% | 0.21% | 0.02% | 0.17% | (0.01%) | 0.08% | 0.23% | (0.05%) | (0.09%) |
| 2020 | 0.39% | 0.27% | (0.22%) | (0.67%) | 0.002% | 0.55% | 0.51% | 0.32% | 0.14% | 0.04% | (0.06%) | 0.09% |
| 2021 | 0.43% | 0.55% | 0.71% | 0.82% | 0.80% | 0.93% | 0.48% | 0.21% | 0.27% | 0.83% | 0.49% | 0.31% |
| 2022 | 0.84% | 0.91% | 1.34% | 0.56% | 1.10% | 1.37% | (0.01%) | (0.04%) | 0.22% | 0.41% | (0.10%) | (0.34%) |
| 2023 | 0.80% | 0.56% | 0.33% | 0.51% | 0.25% | 0.32% | 0.19% | 0.44% | 0.25% | (0.04%) | (0.20%) | (0.10%) |
| 2024 | 0.54% | 0.62% | 0.65% | 0.39% | 0.17% |
See: Monthly Inflation Rate for more information and a complete table of Unadjusted Monthly Rates.
Misery Index
Current Misery Index:
Unemployment 4.0% + Inflation 3.27% = 7.27%
Unemployment was up 0.1% but inflation was down.
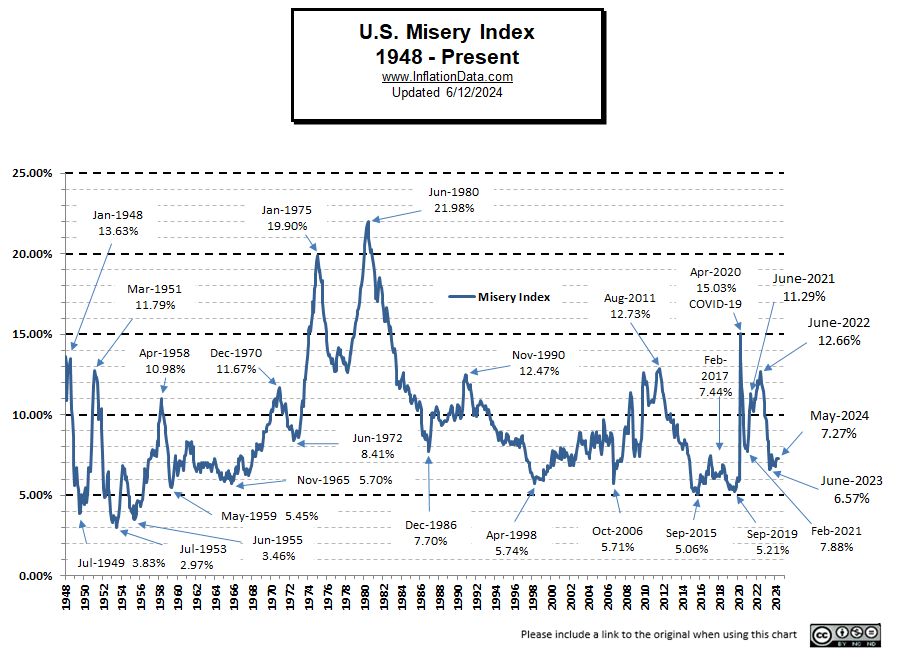
[Read More on the Misery Index…]
Rate of Change (ROC) Charts
We changed the ROC Format and added a Crypto ROC chart. The NASDAQ dipped down from last month (issuing a tentative sell signal) while the NYSE continues upward.
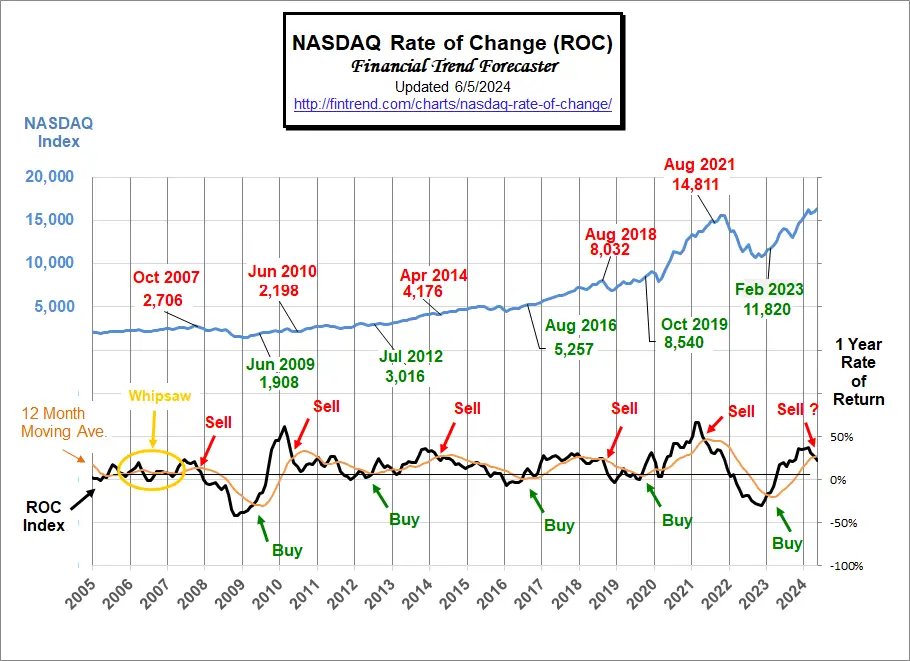
For more information, see NYSE Rate of Change (ROC) and NASDAQ ROC Chart.
You Might Also Like:
From InflationData.com
- If Trump Won the 2020 Election Would Inflation Be Lower?
- How Social Security Tax and Inflation Affect Couples’ Retirement
- Inflation Destroys More Than Money
- How Inflation Is Reshaping the Job Market for New Entrants
- April Inflation Sparks Market
- 4 Key Factors to Consider When Hedging Against Inflation
- Have Wages Kept Up with Inflation
- Not All Prices Have Inflated Since 1964
From Financial Trend Forecaster
- Moore Inflation Predictor
- NYSE ROC
- NASDAQ ROC
- The Tectonic Shift in Crypto
- Crypto Goes Mainstream
- Applying the ROC to Crypto
- Economic Education Has Become Economic Disinformation
- The Modern Day Wild West: Crypto Scams And Opportunities
- Global Debt Levels Are a Ticking Time Bomb
- America’s Fiscal Collapse Accelerates
- Crypto 2.0, A Whole New Ballgame
From UnemploymentData.com.
- May 2024 Employment- Good News is Bad News?
- The American Labor Market: Fact vs. Fiction
- Design Meets Security: Creating Safe and Attractive Commercial Entrances
- Unlocking The Value Of A “Career College” Degree In Today’s Economy
From Elliott Wave University
- Why You Should Pay Attention to This Time-Tested Indicator Now
- Gold: Setting Near-Term Price Targets
- Bob Prechter on the Rich Dad Radio Show
- A.I. Revolution and NVDA: Why Tough Going May Be Ahead
- Free report: ‘Gold Investors’ Survival Guide’
From OptioMoney
- The Importance of Financial Wellness Programs in the Workplace
- How Moving to a New Place Impacts Your Spending Patterns
- The “Ins and Outs” of Energy Efficient Windows
- How to Effectively Manage Credit Cards as a Homeowner
- What are “Moving Loans” and Do You Need One?
From Your Family Finances
- Cost of Living Adjustments: Moving from the North to Florida
- What is Identity Theft and How to Protect Yourself
- Smart Spending for Your Roof: Navigating Costs and Options
- 10 Reasons Millennials Should Start Investing in Real Estate
- Finding Your Way: Navigating Insurance Coverage For Flood Recovery

May 2024 inflation was 3.27% but was listed as 3.17% in the historical table.
Should the entry in the table be corrected?
Thanks James! Good catch. We’ve fixed it. If it doesn’t change please refresh your cache.