
The U.S. Bureau of Labor Statistics (BLS) released its December Inflation report on January 14th, 2020, for the 12 months through the end of December 2019.
December Inflation Jumps Up
- Annual inflation tops the 2019 high set in November at 2.05% reaching 2.29%.
- CPI Index in December was 256.974, November was 257.208 down from October’s 257.346
- Monthly Inflation for December was -0.09% up from -0.32% in December 2018.
- Next release February 13th
The CPI index itself decreased again this month (i.e. prices were actually lower this month than last month). October’s CPI Index was 257.346, November’s decreased to 257.208 and December’s decreased again to 256.974 but each time the Annual inflation rate actually went up. How can this be?
Annual inflation for the 12 months ending in October was 1.76% while the 12 months ending in November was 2.05% i.e. an increase of 0.29% and December’s inflation rate was 2.29% . The key lies in the individual monthly components. What we have been seeing is that although the monthly inflation was negative i.e. disinflationary in both November and December 2019, (causing the CPI index to go down) it was not as negative as it was in 2018. So as the 2018 numbers fell out of the annual inflation calculation and were replaced by less negative numbers the annual inflation rate went up. Last month we said, “ next month we have December 2018’s -0.32% falling out of the equation so we could see another big jump in the annual inflation rate” and that is exactly what happened.
Monthly Inflation:
According to the BLS commissioner’s report, “The Consumer Price Index for All Urban Consumers (CPI-U) rose 0.2 percent in December on a seasonally adjusted basis after rising 0.3 percent in November, the U.S. Bureau of Labor Statistics reported today. Over the last 12 months, the all items index increased 2.3 percent before seasonal adjustment.
The indexes for gasoline, shelter, and medical care all rose in December, accounting for most of the increase in the seasonally adjusted all items index. The gasoline index increased 2.8 percent in December. Other major energy component indexes were mixed, and the energy index rose 1.4 percent.
The food index rose 0.2 percent in December with the indexes for both food at home and food away from home increasing over the month. “
Read the full commentary here.
Seasonally Adjusted Inflation Table
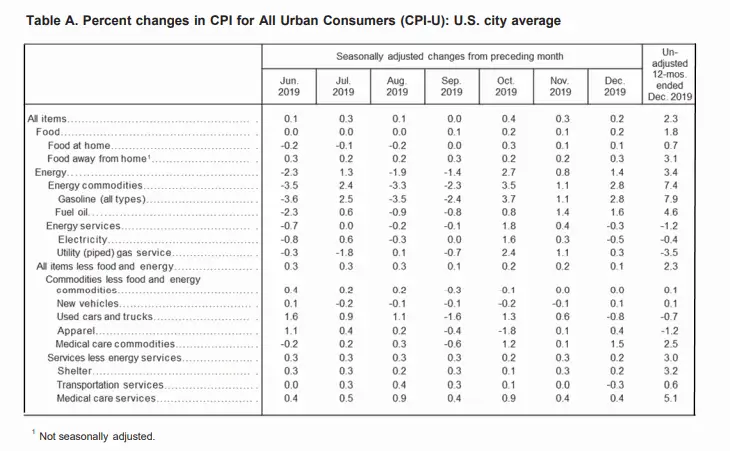
From the December 2019 column in the table above we can see that on a monthly seasonally adjusted basis, Gasoline was up 2.8%. On a Non-adjusted annual basis, however, gasoline was up a whopping 7.9% over the year and fuel oil was up 4.6%. On an annual basis, Food away from home was up 3.1%, shelter was up 3.2%, Used cars and trucks were down -0.7% and Medical care services were up 5.1%.
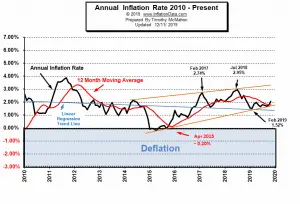
Current Inflation Chart
As we can see from the chart below, throughout 2019 the inflation rate has stayed within a fairly narrow range peaking at 2.0% in April and bottoming at 1.52% in February. But last month inflation ticked up above 2% at 2.05% and it crossed above its 12-month moving average. This month it was up to 2.29%.
Federal Reserve Actions
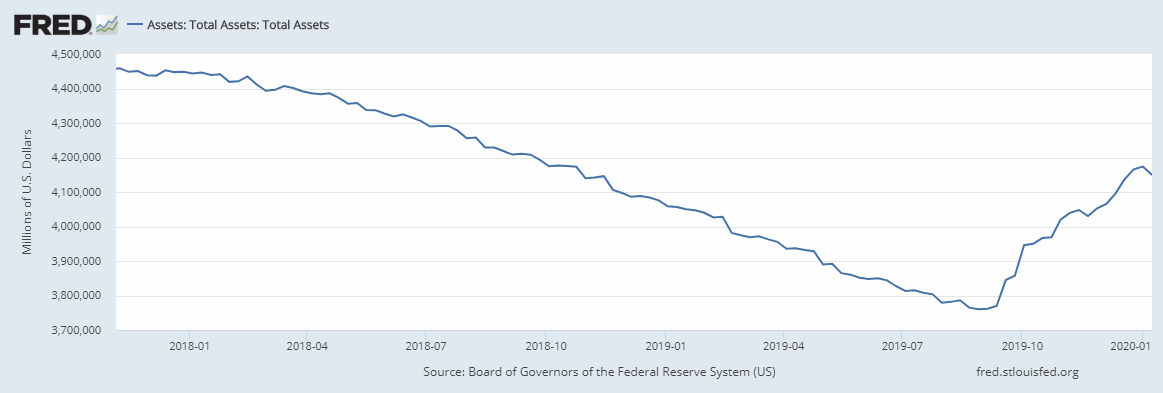
Since the beginning of 2018 the Federal Reserve (FED) has followed a policy of Quantitative Tightening (QT) i.e. they have reduced the amount of “debt” they held. This debt was acquired during the 3 phases of quantitative easing they employed in an effort to add liquidity to the market to combat the 2008 crash. From the chart, we can see that through QT they began eliminating some of the debt they held. But over the last three months, we can see an uptick indicating that they have once again begun accumulating debt again rather than eliminating it. Thus creating inflationary pressures.
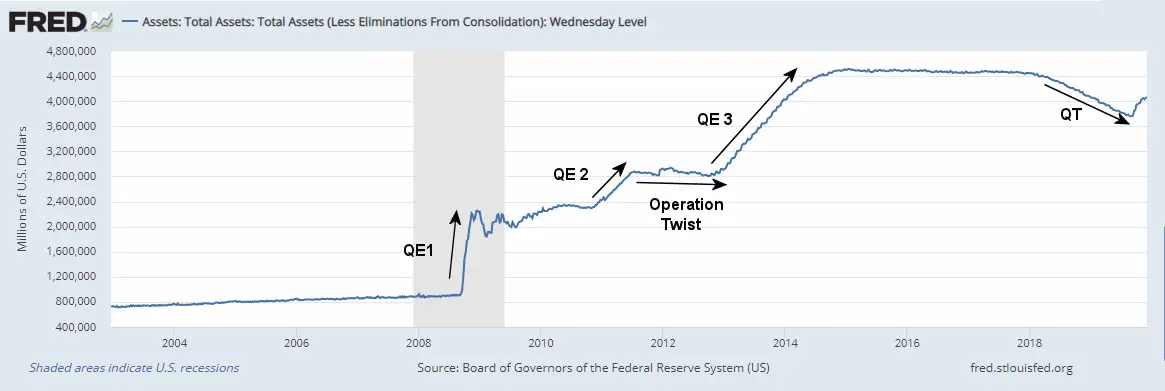
But, in this closer view, we can see after the increase in assets beginning in September the FED has once again started reducing “Assets”. It appears they are once again pursuing a tighter monetary policy, possibly due to the recent increase in inflationary pressures.
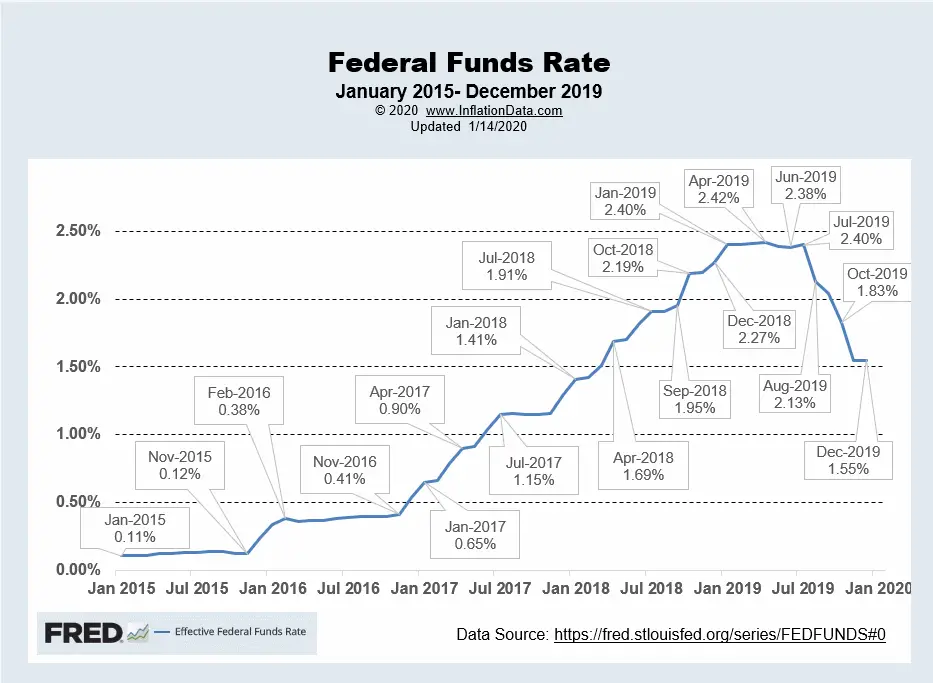
FED Funds Rate
One indicator of the shift from tight money to easy money is when the FED reduces the Fed Funds Rate i.e. the rate the FED charges member banks. The FED drastically reduced interest rates from August through November. But it stopped reductions in December and held steady at 1.55%.
For more info See NYSE ROC and MIP.
Inflation Forecast
See our Moore Inflation Predictor to see our current projections.
Not Seasonally Adjusted Monthly Inflation Rates
| Jan | Feb | Mar | Apr | May | Jun | Jul | Aug | Sep | Oct | Nov | Dec | |
| 2016 | 0.17% | 0.08% | 0.43% | 0.47% | 0.41% | 0.33% | (0.16%) | 0.09% | 0.24% | 0.12% | (0.16%) | 0.03% |
| 2017 | 0.58% | 0.31% | 0.08% | 0.30% | 0.09% | 0.09% | (0.07%) | 0.30% | 0.53% | (0.06%) | 0.00% | (0.06%) |
| 2018 | 0.54% | 0.45% | 0.23% | 0.40% | 0.42% | 0.16% | 0.01% | 0.06% | 0.12% | 0.18% | (0.33%) | (0.32%) |
| 2019 | 0.19% | 0.42% | 0.56% | 0.53% | 0.21% | 0.02% | 0.17% | (0.01%) | 0.08% | 0.23% | (0.05%) | (0.09%) |
See: Monthly Inflation Rate for more information and a complete table of Unadjusted Monthly Rates.
Misery Index
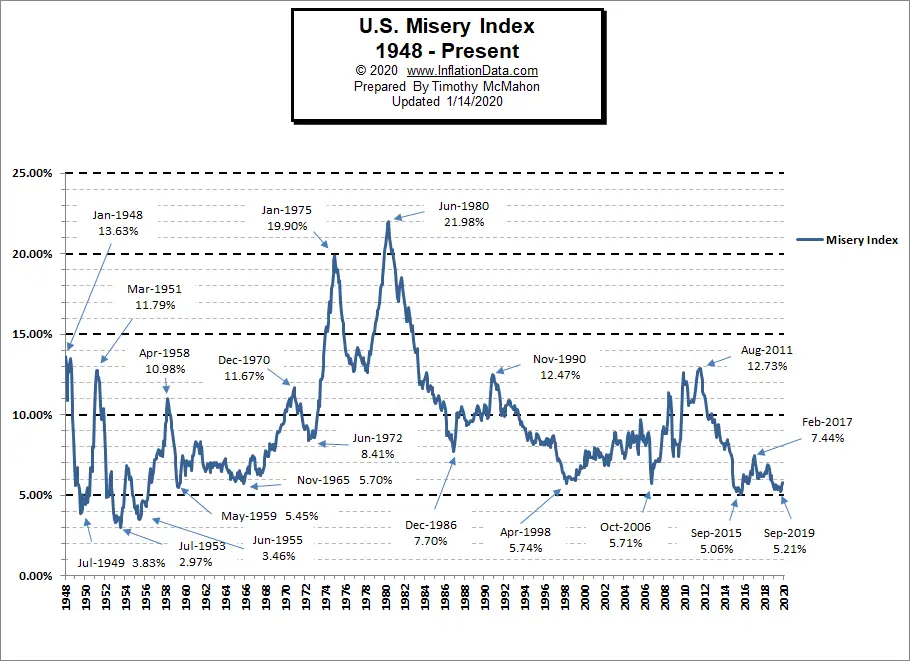
The misery index as of January 2020 (based on the most recent official government inflation and unemployment data for the 12 months ending in December) is at 5.79%. up slightly from 5.55% in November. It was 5.45% in August and 5.51% in July. It has only been this low a few times since data became available in 1948. Surprisingly, one of those times was in September of 2015 when the Misery Index briefly neared 5%. Before that, we had 2006, 1998 and 1965 which were considerably higher at 5.71%, 5.74%, and 5.70% respectively. May of 1959 was 5.45% so you have to go all the way back to 1955 to see a Misery index below 5%.
[Read More…]
NYSE Rate of Change (ROC)©
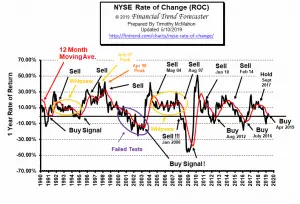
Buy Signal
The market has passed a milestone of doubling since the September 2011 low (up 107%). It is up 3.63% since last month alone after increasing 5.49% in November and 1.18% in December. Results for the previous 3 months were mixed with October being down about -3%, September being up about 4% and August being down about -4.5%. On an annual basis, the NYSE is up 18.6%! Of course, we have to remember that last year the NYSE index had a terrible 4th quarter. It fell -4.93% in October, -0.17% in November, -3.79% in December and -0.18% in January, so it is coming off a low.
See the NYSE ROC for more info.
NASDAQ Rate of Change (ROC)©
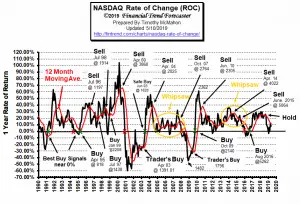
Buy Signal! In October the NASDAQ lost -3.26 and then issued a buy signal as it crossed through its moving average while logging a massive 7.37% return in November. In December it tacked on another 1.53% and then in January it coincidentally logged another 7.37% gain. This gives it an annual 32.43% return and the look of the “honeymoon phase” as the ROC typically does as it crosses upward through its moving average. Eventually, the moving average (MA) makes it up to stratospheric levels and the ROC falls below the MA, whipsawing around for a while before generating a sell signal.
See NASDAQ ROC for more.
Regional Inflation Information
The U.S. Bureau of Labor Statistics also produces regional data. So if you are interested in more localized inflation information you can find it here.
| AL | AK | AR | AZ | CA | CT | CO | DC | DE | FL | GA | GU | HI | IA |
| ID | IL | IN | KS | KY | LA | MA | MD | ME | MI | MN | MO | MS | MT |
| NC | ND | NE | NH | NJ | NM | NV | NY | OH | OK | OR | PA | PR | RI |
| SC | SC | SD | TX | UT | VA | VI | VT | WI | WA | WI | WV |
You Might Also Like:
From InflationData.com
- Modern Monetary Theory
- Investing to Fight Inflation
- Cumulative Inflation By Category 1996-2016
- If Everything Big is Increasing in Cost at Some Rate Faster than Inflation Why Hasn’t Inflation Risen to Match?
Read more on UnemploymentData.com.
- A UK Guide to Getting Back to Work After an Injury
- 4 Well-Paying Jobs for Self-Starters
- Workplace Rights in 2020
- Careers to Consider if You Have a Variety of Job Skills
- How To Get Back to Work After a Long Illness
From Financial Trend Forecaster
- Gold is Still King of the Investing Market
- The Markets in Perspective: What Goes up Must Come down?
- Is Bill Gates Right On Energy Investing?
- The Oil Crisis Saudi Arabia Can’t Solve
- Weakening Shale Productivity “VERY Bullish” For Oil Prices
- 5 Ways Automation Has Changed the Financial World
- Asteroid Mining: Science Fiction or Science?
From Elliott Wave University
- The Beginning of a Long-Term “Secular” Bull Market?
- What Does this Rare & Rapid Drop in Manufacturing Mean?
- Bullish Signal Has Only Happened 10 Times in the Last 94 Years.
- Spotting a 178-Year-Old Firm’s Collapse… 2 Years in Advance
- Trade, Impeachment, and the Conviction of Buyers and Sellers
From OptioMoney.com
- Five Business Tips to Help Your Company Thrive
- Have Minimal Car Insurance? What to Do in Case of an Accident
- How to Choose a Residential Roofing Contractor
- Avoid a Money Pit: 4 Vital Inspection Items before Buying an Older Home
- 3 Benefits of Finding a Reliable Family Lawyer
- 4 Hidden Car Costs
From Your Family Finances
- 3 Hacks in Building Your Family’s Emergency Fund
- How to Keep Your Home’s Heating Bill from Rising When Temperatures Fall
- How Will a Fender Bender Affect Your Long Term Finances?
- The Insurance You Need to Protect Your Family
- Financial Options: How to Limit Your Annual Expenses

Leave a Reply