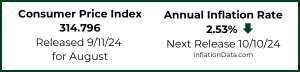
The Bureau of Labor Statistics reported that Annual Inflation for October 2022, fell from 8.20% to 7.75%
Monthly inflation at 0.41% was still very high for a month in the fourth quarter, which is traditionally negative or at least very close to zero.
But although high, October 2022 monthly inflation was still lower than in October 2021. So…
Annual inflation for the 12 months ending in October 2022 fell to 7.75%.
This was down from 8.20% in September 2022.
Inflation Summary:
- Annual Inflation fell from 8.20% to 7.75%
- CPI Index rose from 296.808 to 298.012
- Monthly Inflation for October was 0.41%
- Next release is December 13th
October Annual Inflation was 7.75%.
Jan. 2021 — 1.40% | Jan. 2022 — 7.48% | Feb. 2022 — 7.87% | March 8.54% |
Apr. 2022 –8.26% | May 2022 — 8.58% | June 2022 — 9.06% | July 2022 — 8.56%% |
August 2022 — 8.26% | September — 8.20% | October — 7.75%
The stock market saw this as an encouraging event, and the NYSE rallied 4.4% on the day while the NASDAQ rallied 2.2%.
BLS Inflation Report:
The BLS Commissioner reported, “The Consumer Price Index for All Urban Consumers (CPI-U) rose 0.4 percent in October on a seasonally adjusted basis, the same increase as in September, the U.S. Bureau of Labor Statistics reported today. Over the last 12 months, the all items index increased 7.7 percent before seasonal adjustment.
The index for shelter contributed over half of the monthly all items increase, with the indexes for gasoline and food also increasing. The energy index increased 1.8 percent over the month as the gasoline index and the electricity index rose, but the natural gas index decreased. The food index increased 0.6 percent over the month with the food at home index rising 0.4 percent.”
On an annual (non-adjusted) basis, inflation fell from 8.20% to 7.75%. Looking at the monthly changes in the chart below, we can see that Food Increased 6/10ths of a percent while energy rose 1.8%. New vehicles rose 4/10ths of a percent while used vehicles fell -2.4%. Shelter and Transportation rose, while medical care fell. Fuel oil was the biggest gainer, with a massive almost 20% gain for the month and a 68.5% gain for the year. 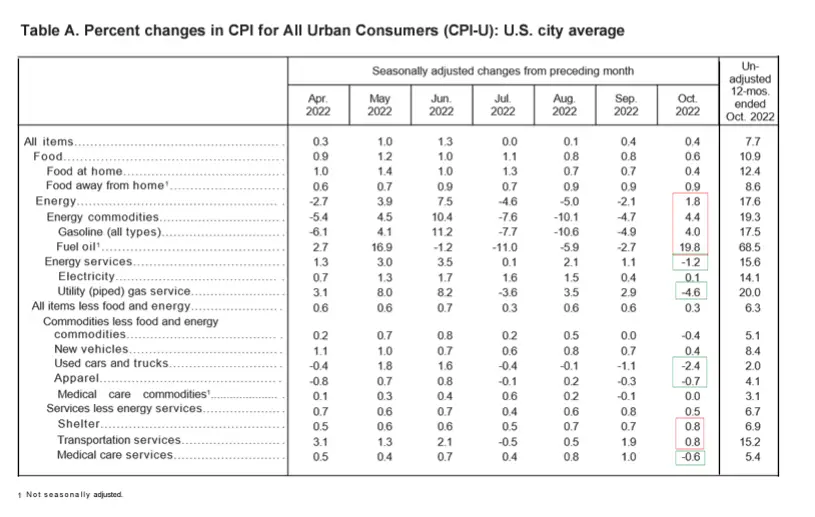
Monthly Inflation Compared to Previous Years:
Although July and August were significantly lower than the previous couple of years, September 2022 was only slightly lower than September 2021, but October 2022 was well below October 2021 but not as low as a typical October. Last month we said, “Because of the extremely high 2021 numbers, the next three months should be lower than 2021, bringing annual inflation down.”And that is what happened in October.
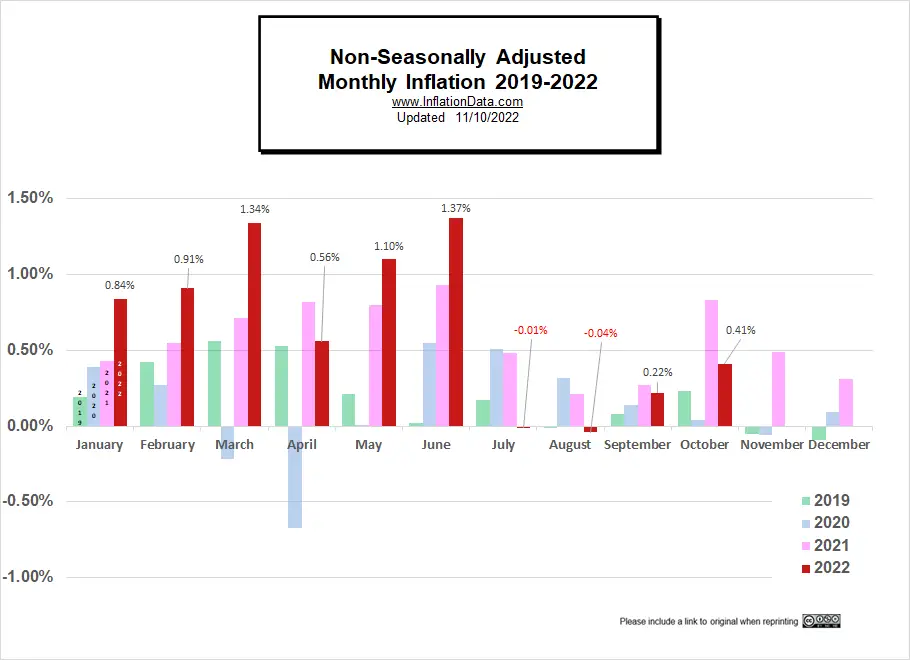
Not Seasonally Adjusted Monthly Inflation Rates
Note: January 2022’s 0.84% was the highest January since 1990. June was the highest June since 1941 (although the first quarter of 1980 had some higher rates). Typically, June is the beginning of lower monthly rates.
| Jan | Feb | Mar | Apr | May | Jun | Jul | Aug | Sep | Oct | Nov | Dec | |
| 2016 | 0.17% | 0.08% | 0.43% | 0.47% | 0.41% | 0.33% | (0.16%) | 0.09% | 0.24% | 0.12% | (0.16%) | 0.03% |
| 2017 | 0.58% | 0.31% | 0.08% | 0.30% | 0.09% | 0.09% | (0.07%) | 0.30% | 0.53% | (0.06%) | 0.002% | (0.06%) |
| 2018 | 0.54% | 0.45% | 0.23% | 0.40% | 0.42% | 0.16% | 0.01% | 0.06% | 0.12% | 0.18% | (0.33%) | (0.32%) |
| 2019 | 0.19% | 0.42% | 0.56% | 0.53% | 0.21% | 0.02% | 0.17% | (0.01%) | 0.08% | 0.23% | (0.05%) | (0.09%) |
| 2020 | 0.39% | 0.27% | (0.22%) | (0.67%) | 0.002% | 0.55% | 0.51% | 0.32% | 0.14% | 0.04% | (0.06%) | 0.09% |
| 2021 | 0.43% | 0.55% | 0.71% | 0.82% | 0.80% | 0.93% | 0.48% | 0.21% | 0.27% | 0.83% | 0.49% | 0.31% |
| 2022 | 0.84% | 0.91% | 1.34% | 0.56% | 1.10% | 1.37% | (0.01%) | (0.04%) | 0.22% | 0.41% |
See: Monthly Inflation Rate for more information and a complete table of Unadjusted Monthly Rates.
Inflation Forecast
Looking back at our August Inflation projection, we can see that in the wake of the FED’s aggressive tightening and SPR oil releases, inflation is tracking our extreme low projection. This is encouraging after their slow start earlier this year. The only caveat I’ve heard is that, hopefully, they won’t overdo it to make up for the late start.
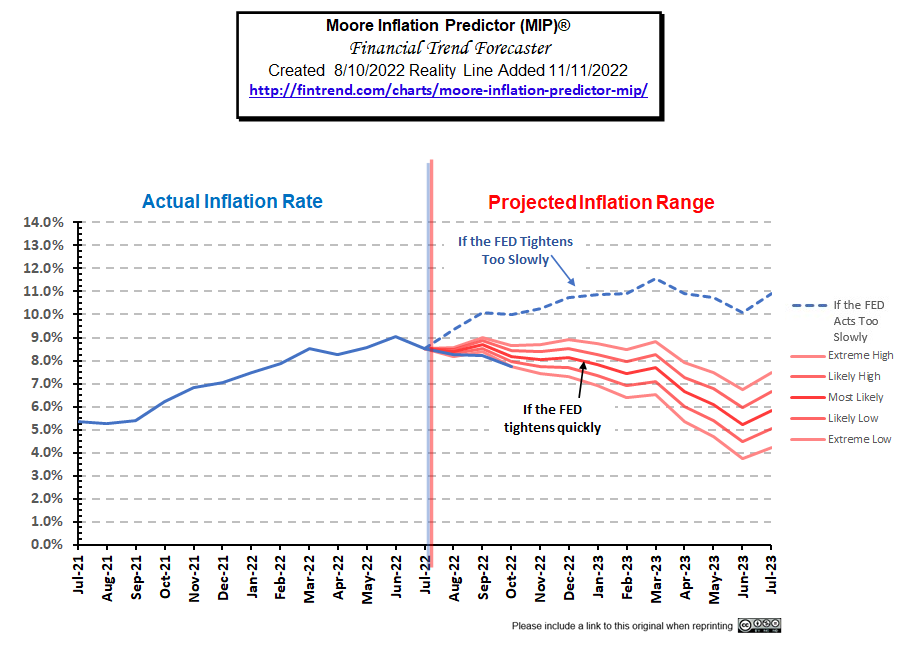 See this month’s MIP Chart here.
Inflation All Items vs. Core Inflation Chart
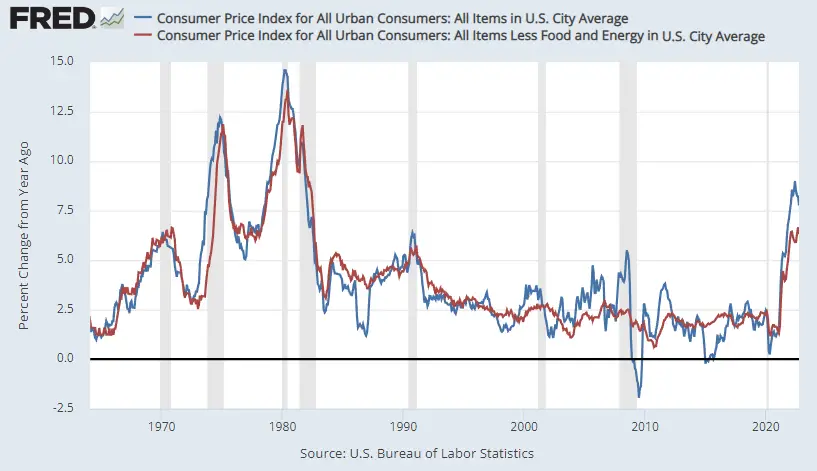
Looking at the chart above from the St. Louis FED, we can see the difference between inflation with food and energy and without. The red line shows the annual inflation rate minus food and energy. With the large gap between core inflation and total inflation, we can see that food and energy are a significant portion of total inflation. It is generally thought that food and energy are almost outside FED control, but core inflation is a monetary issue. Therefore, although food and energy are significant factors here, the vast majority of inflation can still be laid at the FED’s doorstep.
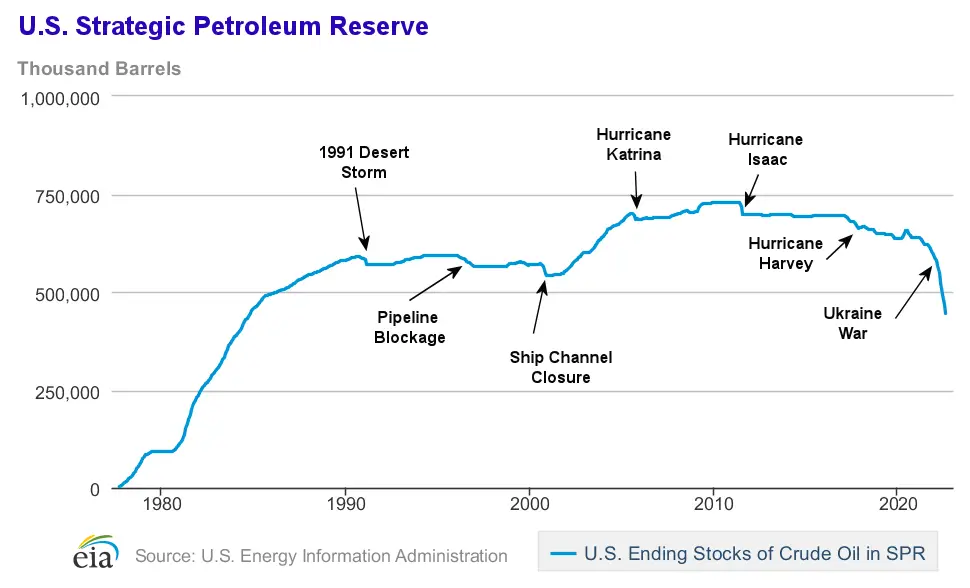
Crude Oil
In an effort to keep oil prices low, the Biden administration has been draining the Strategic Petroleum Reserve (SPR), but that can’t continue forever. As we can see in the chart below, the current drawdown is significantly larger than any previous decline. Even the Desert Storm drawdown is dwarfed by the current drain.
We’ve updated the Inflation-adjusted crude oil price chart.
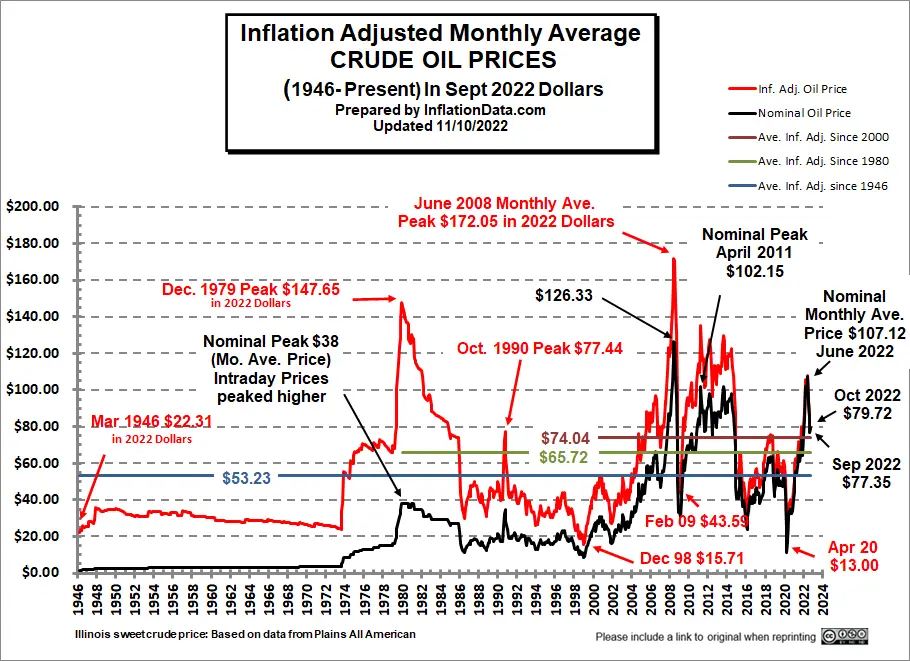 Read more and see historical Crude Oil prices here.
FED Assets
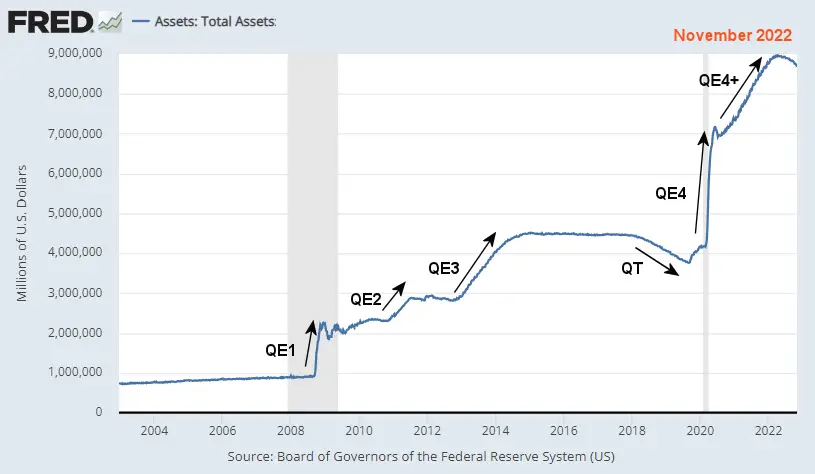
The FED’s total assets have started to level out and even declined a bit, but there is a long way to go to get back to 2019 levels, and that will involve a lot of economic pain, so the question is if the FED will chicken out before it gets there.
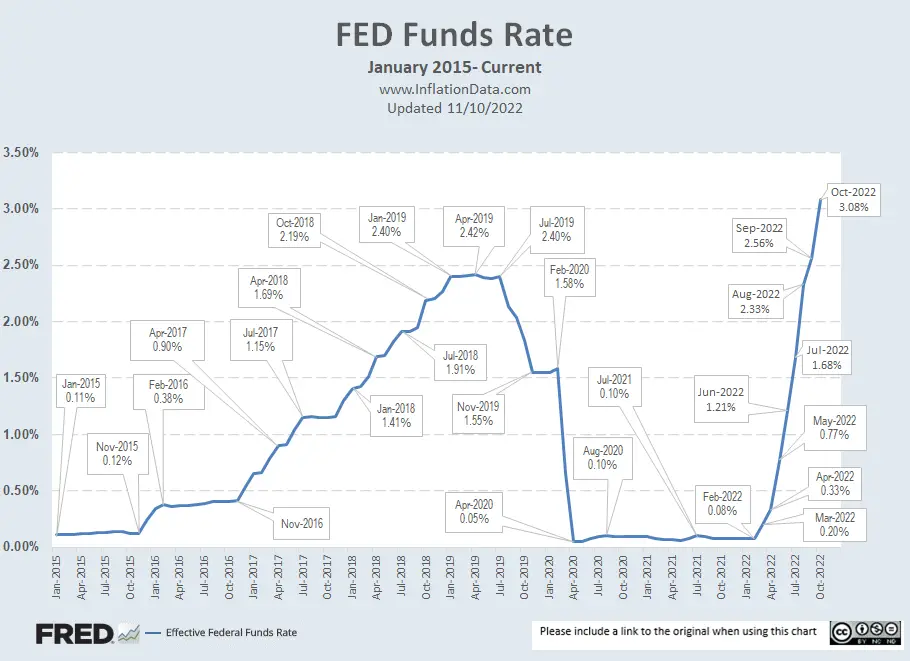
The FED’s Interest Rate Policy
The chart below shows that the FED has raised rates a full 3% from 0.08% in February to 3.08% in October, bringing levels above 2019 levels. The market is now expecting a monthly increase of .75%, but some people like Scott Buchta at Brean Capital are calling for more, i.e., a full 1%. Although I think the FED was late coming to this party, there is no reason for them to go crazy overreacting.
Looking at the longer-term chart, we can see that on a historical basis, current levels are still low. Despite all the raising, prior to 2008, there are only a couple of instances where rates have been as low as they are now.
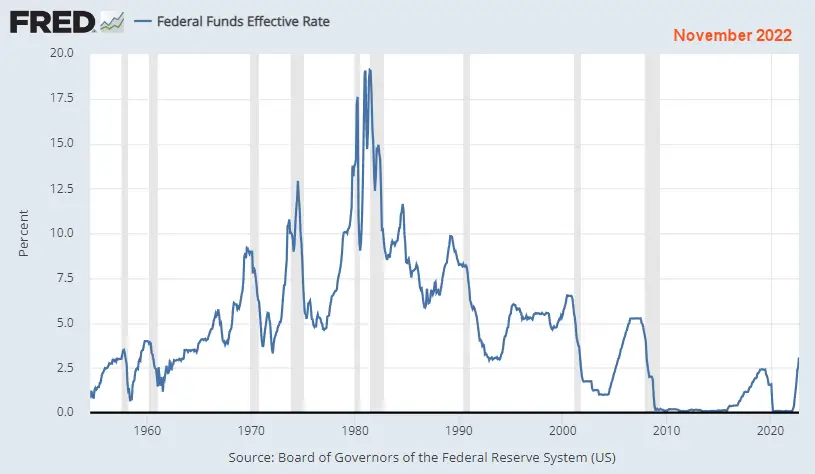
Chart Data Source St Louis FED.
For more info, See NYSE ROC and MIP.
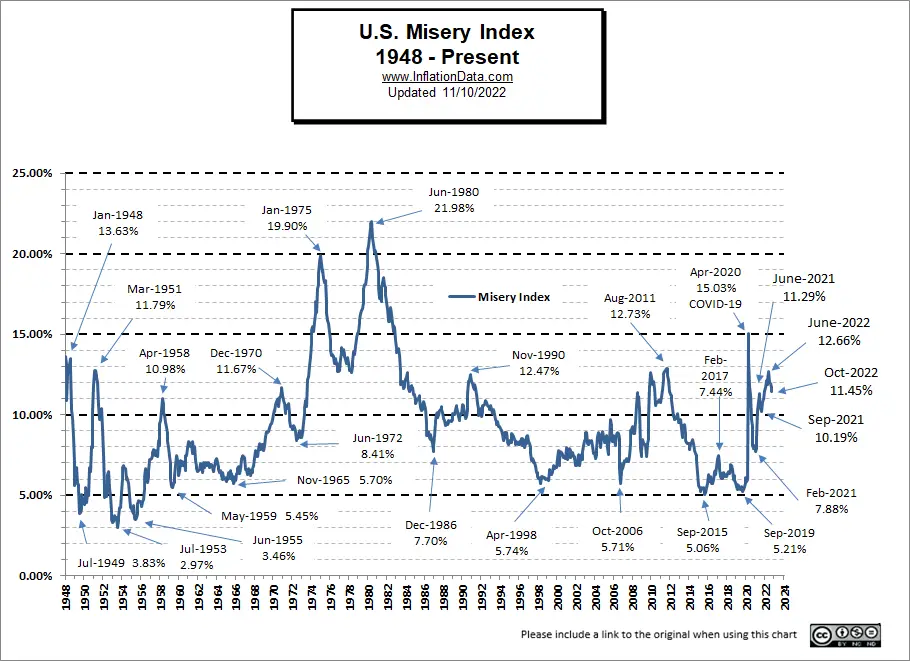
Misery Index
Unemployment was up in October, and Inflation was down. The Misery index decreased slightly to levels very similar to January 2022.
| Unemployment | Inflation | Misery Index | |
| January 2022 | 4.0% | 7.48% | 11.48% |
| February 2022 | 3.8% | 7.87% | 11.67% |
| March 2022 | 3.6% | 8.54% | 12.14% |
| April 2022 | 3.6% | 8.26% | 11.86% |
| May 2022 | 3.6% | 8.58% | 12.18% |
| June 2022 | 3.6% | 9.06% | 12.66% |
| July 2022 | 3.5% | 8.52% | 12.02% |
| August 2022 | 3.7% | 8.26% | 11.96% |
| September 2022 | 3.5% | 8.2% | 11.70% |
| October 2022 | 3.7% | 7.75% | 11.45% |
[Read More on the Misery Index…]
NYSE Rate of Change (ROC)©

Sell Signal
The NYSE ROC index is still WAY below its moving average.
See the NYSE ROC for more info.
NASDAQ Rate of Change (ROC)©

Sell Signal
The NASDAQ ROC remains well below its moving average too.
See NASDAQ ROC for more.
You Might Also Like:
From InflationData.com
- November FED Announcement Rocks Stock Market
- What is the Reverse Wealth Effect and Why Does the FED Want It?
- September 2022 Inflation Virtually Unchanged
- Jerome Powell “Channels” His Inner Paul Volcker
From Financial Trend Forecaster
- NYSE ROC Chart
- NASDAQ ROC Chart
- Is the U.S. Dollar Hegemony Ending?
- Latest Recession Alarm
- Housing Is Getting Less Affordable
- Are Housing Prices Set to Crash?
- Half-Way to the Stock Market’s Worst Case Scenario
- Don’t Fight the FED
- Will Loan Forgiveness Raise College Costs?
- How Long Will This Recession Last?
- Is The U.S. A Powerful “Empire” In Decline?
From UnemploymentData.com.
- October 2022 BLS Employment Report
- Love to Drive? These 6 Jobs Are For You
- September Unemployment Falls… Dragging Market Down
- Injured on the Job? 3 Things to Immediately Do
- 5 Signs It’s Time to Make a Career Change
From Elliott Wave University
- Are You Prepared for Widespread Bank Failures?
- Will Another “Great Depression” Start in Europe?
- Stocks Don’t Go Straight Up (or Straight Down)
- What the “Housing Busts” Indicator Is Saying Now
- How to Prepare for a Hard-Hitting Bear Market (Think 1929-1932)
From OptioMoney
- Warning Signs You’re On the Road to Financial Catastrophe
- Money Habits That Can Help You Retire Early
- 7 Ways to Save Money When Living in a Big City
- How Addiction Can Cause Financial Trouble
- Common Mistakes to Avoid When Investing in Real Estate
From Your Family Finances
- 4 Side Hustles to Pocket Some Coin
- How to Successfully Reach Your Financial Goals
- Documents You’ll Need When Buying Your First Home
- Devastating Budget Buster Or Timely Car Repair?
- 7 Ways To Save Money This Fall

Leave a Reply