
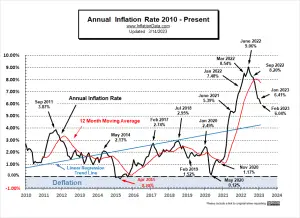
The Bureau of Labor Statistics reported that Annual Inflation fell from 6.41% in January to 6.04% in February Monthly inflation was 0.56% for February 2023, compared to 0.91% in 2022. Despite the significant drop in inflation the market was more concerned with bank failures so, there was no inflation rally. February Inflation Summary: Annual Inflation fell from 6.41% to 6.04% CPI Index rose from 299.170 to 300.840 Monthly Inflation for February was 0.56% Next release April … [Read more...]
Falling Inflation is Good for Stocks
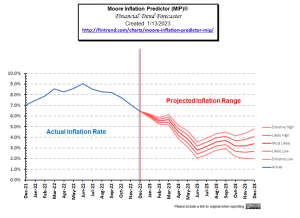
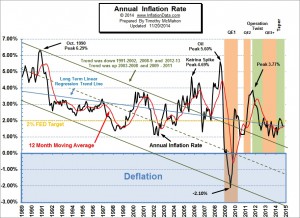
Historically, Stocks tend to soar in years when inflation is falling. But typically, inflation doesn't fall until the fed-funds rate rises above the current inflation rate... The last data we have as of this writing is that inflation was 6.45% in December, and the FED funds rate was 4.1%. That is still a significant gap. But inflation is already falling. Monthly inflation began a dramatic slowdown last July. Monthly inflation has fallen by 80% over that timeframe (bringing annual inflation down by 33%). At this point, the majority of our annual inflation occurred during the first six months of 2022. January through June of 2022 had an average of 1.02% inflation per month. The second … [Read more...]
Is the FED Tightening or Is Hyperinflation on the Horizon?
Recently a prophecy has been trending on YouTube. In it, the possibility of major upheaval in November is mentioned, combined with the possibility of hyperinflation. As I've mentioned before, beginning in March 2020, the FED created massive amounts of liquidity through Quantitative Easing in an effort to combat the monetary effects of shutting the country down due to the virus. If that is combined with a reduction in the quantity of goods and services created due to the virus or riots shutting down the means of production we could see hyperinflation. So that would play into fulfilling that prophesy. Back on April 1st, I wrote an article entitled Will the $2 Trillion Covid-19 Stimulus … [Read more...]
Will the $2 Trillion Covid-19 Stimulus Cause Inflation?
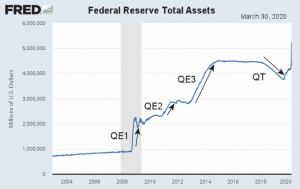
The current round of massive Corona Virus easing began Monday March 16th, 2020, with the FED buying $40 billion in Treasuries and then buying another $50 billion in Treasuries on Tuesday. By Thursday morning, it had upped the plan to $75 billion PER DAY and added $10 billion in mortgage securities. By Friday morning, the Fed had decided to buy $107 billion worth of Treasuries and mortgage-backed securities. In its first week, the FED purchased $317 billion worth of assets, which is slightly faster than the Fed balance sheet grew at the height of the 2008-2009 financial crisis. Initially, the Federal Reserve estimated purchases of $500 billion but FED chief Jerome Powell said the initial … [Read more...]
What Impact Does Interest Rates and Inflation Targets Have on Stocks?
Why is The FED's Targeted Inflation Rate Important in the US? Since 2012, the Fed has targeted an inflation rate of 2%. They have deemed this a healthy rate of inflation, necessary for economic growth. According to the Board of Governors of the Federal Reserve System, since 1977, the Federal Reserve has operated under a mandate from Congress to "promote effectively the goals of maximum employment, stable prices, and moderate long term interest rates" this is called a "dual mandate" in that it is supposed to balance a healthy economy with stable prices not just target low inflation. When the FOMC (Federal Open Market Committee) meets, their job is to fulfill this mandate. The Fed has … [Read more...]
Inflation Rate Falls for April
The U.S. Bureau of Labor Statistics (BLS) released the monthly and annual Inflation numbers for April 2017. Annual inflation was 2.20% down from 2.38% in March, 2.74% in February, and 2.50% in January but above the 2.07% in December. Consumer Price Index (CPI-U) 244.524 up from 243.801 in March Monthly Inflation for April was 0.30% very close to February's 0.31% and similar to the average between March's 0.08% and January's 0.58%. Next release June 14th With Inflation falling almost 2/10ths of a percent and unemployment down one-tenth of a percent the Misery Index is down 3/10ths of a percent. The misery index helps … [Read more...]
CPI Index Down but Annual Inflation Flat
The Bureau of Labor Statistics (BLS) released their monthly Consumer Price Index (CPI-U) and Inflation report for the year ending in August on September 16th. The CPI index fell slightly from 238.654 in July to 238.316 in August resulting in monthly deflation but Annual Inflation for the year ending in August was 0.20% up from 0.17% for the year ending in July. That means that something that cost $100 a year ago would cost $100.20 today. That is compared to the typical inflation of around 3% which would mean that something that cost $100 last year would cost $103 this year. The CPI-U index a year ago was 237.852 and is currently 238.316. On an Annual basis Energy fell 15.0% over the … [Read more...]
Annual Inflation Below 1%
The U.S. Bureau of Labor Statistics released their monthly Consumer Price Index (CPI) data on Friday January 16th for December and for the first time since 2009 reported annual inflation below 1% (although we calculated October 2013 at 0.96%). The Consumer Price Index (CPI) for December was 234.812 down from November’s 236.151 which was also down from 237.433 for October. This resulted in a monthly decrease in prices of -0.57% and an annual inflation rate of 0.76%. Overall energy on a “seasonally adjusted” basis was down -4.7% for the month and -10.6% on an unadjusted basis for the entire year. Fuel oil fell -7.8% for the month (adjusted) and a whopping -19.1% annually. Gasoline was … [Read more...]
Stocks Typically Fall Faster Than They Rise
Online stock market investing is a risky prospect these days. For a limited time you can download a free copy of the May issue of Elliott Wave Financial Forecast to help you decide how you should proceed for the rest of 2012 and beyond ~editor The Smell of Fear: Detecting the Dow's Scent Stocks typically fall faster than they rise Rising stock prices vs. investor fear: When one is present, the other is usually absent. Yet the two were actually in each other's company around the time of the most recent high in the Dow Industrials (May 1): This week the Dow carried to a new recovery high without generating a corresponding new low in the VIX. This suggests a sudden hesitancy compared … [Read more...]
Inflation Adjusted Stock Prices
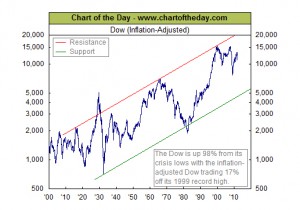
Adjusted Stock Price Financial advisors will often tell us of the steady increases available only through the stock market and present us with beautiful charts showing the relentless march of the the stockmarket ever higher and to the right. But what about inflation? How does the stock market perform when inflation is taken into consideration? After we take the loss of purchasing power into account have all the gains disappeared? When adjusting stock prices for inflation we typically use the US Bureau of Labor Statistics Consumer Price Index CPI-U. Prices are then calculated in "real" dollars. That means that the price is adjusted so that we can see what it would have cost if prices … [Read more...]
