
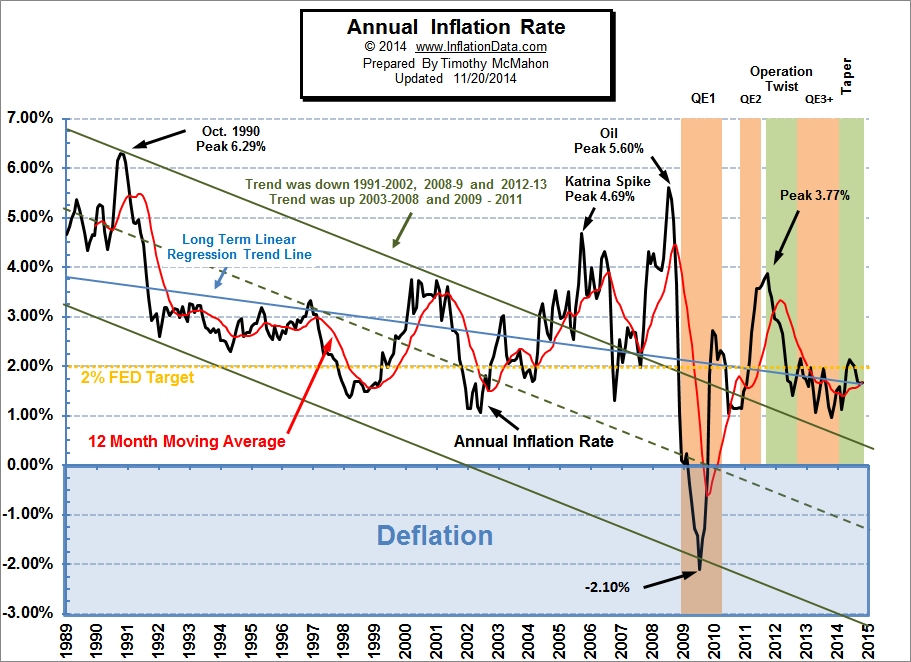
 The U.S. Bureau of Labor Statistics released their monthly Consumer Price Index (CPI) data on Friday January 16th for December and for the first time since 2009 reported annual inflation below 1% (although we calculated October 2013 at 0.96%). The Consumer Price Index (CPI) for December was 234.812 down from November’s 236.151 which was also down from 237.433 for October. This resulted in a monthly decrease in prices of -0.57% and an annual inflation rate of 0.76%.
Overall energy on a “seasonally adjusted” basis was down -4.7% for the month and -10.6% on an unadjusted basis for the entire year. Fuel oil fell -7.8% for the month (adjusted) and a whopping -19.1% annually. Gasoline was down -9.3% monthly and -21.0% annually. On an annual basis electricity rose 3.1% and Natural gas rose 5.8%.
 View the chart and read the full commentary on the current annual inflation rate.
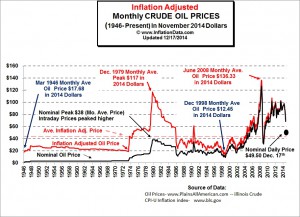
The major factor in the falling inflation rate was a sharp decline in the price of energy especially Oil and Gasoline. To get a true picture of where energy prices are going (and have been) you need to look at the inflation adjusted price of crude oil.
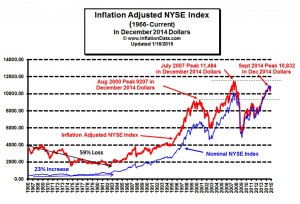 In addition to oil prices another big item in the news lately has been the stock market. It made new nominal highs back in September before pulling back but what does that mean when inflation is taken into consideration? This month we have also updated the inflation adjusted NYSE stock price chart.
In case you missed it:
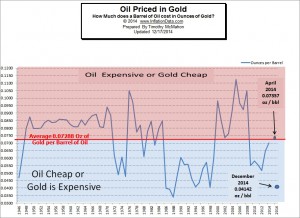 Last month we published a comparison chart with Oil vs Gold so you can see how the two commodities compare without having to worry about the value of a dollar at all.
The Misery Index:
The misery index as of January 2015 (based on the most recent official government data for December 2014) is at 6.36% (5.6% unemployment and 0.76% inflation) down from a peak of 12.87% in both October and November 2011 which was pretty miserable. With inflation at historically low levels the major component of the Misery index is unemployment. The average inflation rate since the beginning of the Misery Index in January 1948 is 3.63% which is 2.87% higher than current inflation levels so if inflation were “average” the misery index would be much higher.
Unemployment:
According to the BLS in 2007 there were 146,047,000 employed out of a civilian non-institutional population of 231,867,000 or 66%. In 2014 there were 146,305,000 employed out of a civilian non-institutional population of 247,947,000 or 62.9% so there is 3.1% more of the population unemployed than there was in 2007 but Seasonally Adjusted Unemployment in December 2007 was 5% and Seasonally Adjusted Unemployment in December 2014 was 5.6%. So somehow that additional 3.1% of unemployed population only translates into an additional 0.6% unemployment. It appears that the answer to unemployment is simply to take them out of the labor force and they no longer count as “unemployed”. In 2007 there were 78,743,000 “not in labor force” but in 2014 the number had increased to 92,025,000. of course some of these people retired but others simply gave up looking for work. In 2007 there were 7,078,000 unemployed but in 2014 there were 11,460,000 unemployed.
The 1980’s
In addition we’ve added a brief description of the economic situation during the 1980’s to complement our other decade articles.
- Inflation and Consumer Price Index- Decade Commentary
- Inflation and CPI 1913-1919
- Inflation and CPI 1920-1929
- Inflation and CPI 1930-1939
- Inflation and CPI 1940-1949
- Inflation and CPI 1950-1959
- Inflation and CPI 1960-1969
- Inflation and CPI 1970-1979

Leave a Reply