
Recently a prophecy has been trending on YouTube. In it, the possibility of major upheaval in November is mentioned, combined with the possibility of hyperinflation. As I’ve mentioned before, beginning in March 2020, the FED created massive amounts of liquidity through Quantitative Easing in an effort to combat the monetary effects of shutting the country down due to the virus.
If that is combined with a reduction in the quantity of goods and services created due to the virus or riots shutting down the means of production we could see hyperinflation. So that would play into fulfilling that prophesy. Back on April 1st, I wrote an article entitled Will the $2 Trillion Covid-19 Stimulus Cause Inflation? In which I said, basically that if all the money the FED creates goes back into pumping up the stock market then we might not see prices rise.
The FED Reverses Course
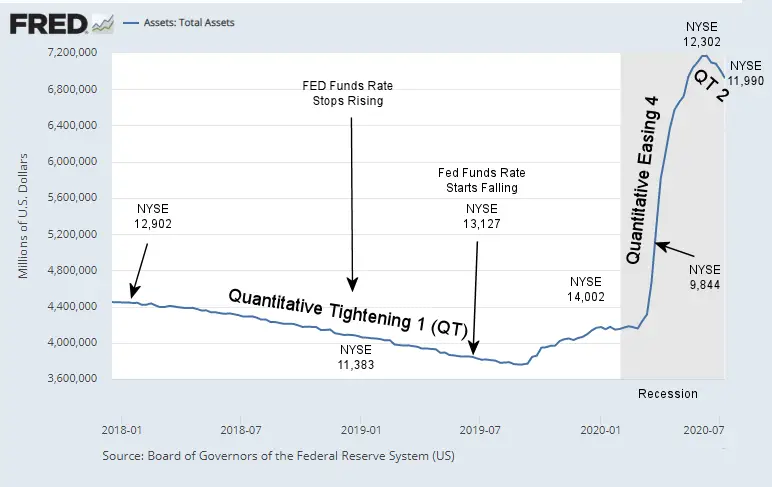
Beginning in June the FED did something that began contracting the money supply. The question remains: What did they do, and what effect will it have on the stock market? At this point, it appears that much of the liquidity created to combat the COVID virus has gone into pumping up the market… since it rose from 9,844 on April 1 to 12,302 on June 1. So what happens when that FED money dries up?
In the following chart, we can see a rather sharp contraction beginning on June 1, at which point the NYSE was 12,302 up from 9,844 on April 1, 2020. But let’s back up and start looking in January 2018. At that point, the FED held 4.4 Trillion in assets and really thought that was way too much… so they began slowly reducing those assets. By January 2019 they had “only” shed 0.4 Trillion but the NYSE had shed over 1,500 points or roughly 11.8%. (We can also see that they believe that a recession began in February i.e. grey shaded area).
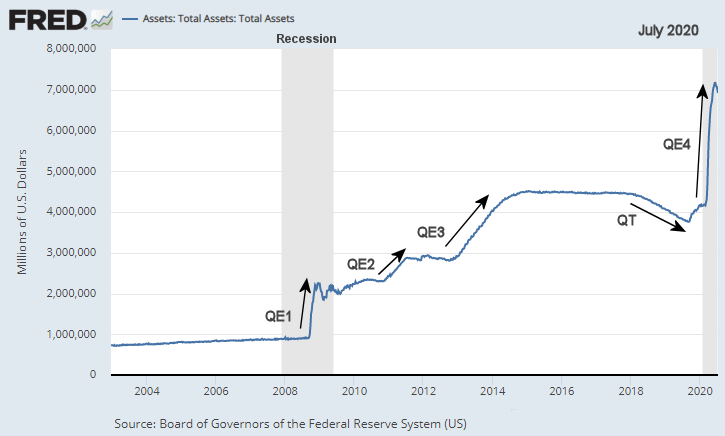
Looking at the longer-term chart of FED assets we can see that QE 4 was much larger than any of the previous easings and equally sharp to QE 1.
Was QT the Cause?
The question arises, whether the Quantitative Tightening (QT) was the cause of the market slide? After all, FED assets continued to fall but the market rebounded. So let’s look at the FED Funds rate and see what was happening. During 2018 the FED Funds rate steadily climbed about 1%. So this combined with the restricted liquidity of QT seems to have been enough to send the market into a tailspin. From January 2019 through July 2019 the FED Funds rate held relatively steady around 2.4% even though QT continued at roughly the same rate. During that time the market rebounded to slightly above where it was back in January 2018.
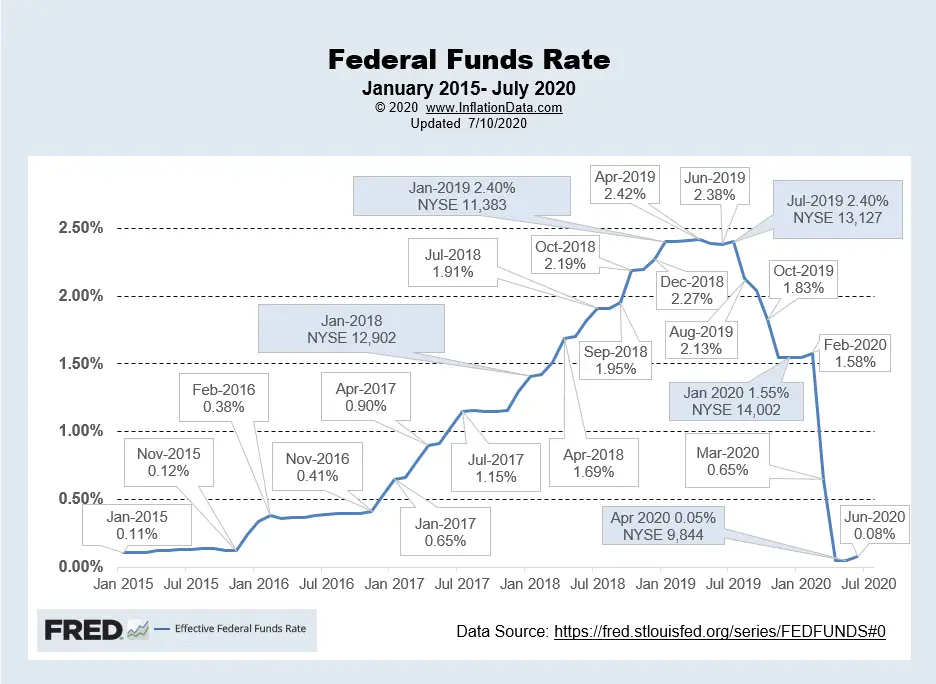 Over the next six months, the FED felt the economy was faltering and so they cut interest rates from 2.4% to 1.55% and undid pretty much all of the previous quantitative tightening. So by January 2020, the NYSE was at 14,002. And then along came the COVID virus and by April 1 the NYSE was down to 9,844 and the FED had lowered interest rates to virtually zero i.e. 0.05% and FED assets had risen to around $7.2 TRILLION.
Along Comes June
In June the FED quietly reversed course once again and let interest rates rise slightly from 0.05% in May (same as April) to 0.08%. This in itself isn’t terribly significant. But it was combined with another 0.4 Trillion reduction in assets. Remember in QT #1 it took a whole year to reduce assets by that same amount. This time the FED did it in one month! The result of this double whammy? The NYSE fell by 312 points or roughly 2.5%.
FED Balance Sheet Makeup
So in a few short months in 2020 the FED increased its balance sheet by over $3 Trillion. So, exactly what assets did the FED buy with that $3+ Trillion? Did they invest in the market directly to shore it up? Or did they spend the entire amount on Treasury bonds?
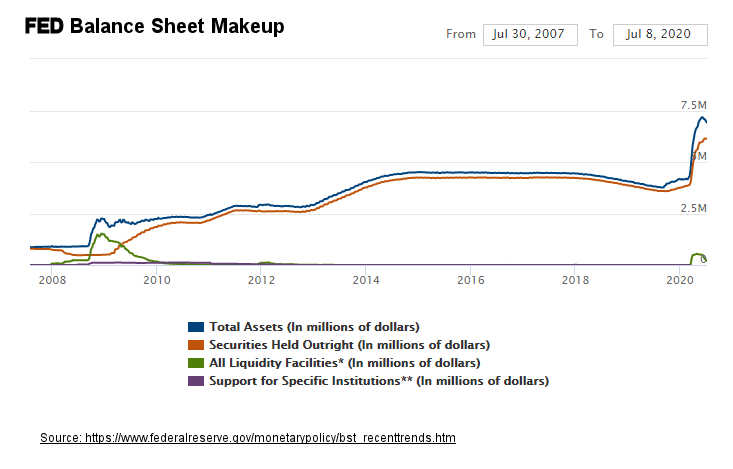
The chart above from the Federal Reserve shows that the vast majority of FED assets are actually “Securities”. And the recent drop in Assets is the result not of selling securities but due to a drop in “Liquidity Facilities”.
According to their footnote: “Liquidity Facilities includes: Term Auction credit; primary credit; secondary credit; seasonal credit; Primary Dealer Credit Facility; Asset-Backed Commercial Paper Money Market Mutual Fund Liquidity Facility; Term Asset-Backed Securities Loan Facility; Commercial Paper Funding Facility; Money Market Mutual Fund Liquidity Facility; and central bank liquidity swaps.”
From the chart, we can see that typically “Liquidity Facilities” are at or near zero and only bounce up during times of crisis, so the fact that they are falling is actually good news.
Typically the FED buys things like U.S. Sovereign Debt i.e. Treasury Bills notes etc., Municipal Bonds, Corporate Bonds, and short-term Corporate debt but not “stocks” except in special situations.
The total value of the U.S. stock market was roughly $37.7 Trillion at the end of 2019 and the U.S. Bond market was well over $40 Trillion. On March 2nd the FED held $3.876 Trillion in Securities. On June 22nd the FED held $6.145 Trillion in Securities, for an increase of $2.269 Trillion or roughly 6% of the value of the entire U.S. stock market. Did boosting liquidity by 6% boost the stock market? Most certainly! In total, the FED now holds $6.145/$37.7 Trillion or roughly 16% of the value of the entire stock market (whether they are holding stocks or bonds it is still a large portion of the overall market).
Questions, Questions, and More Questions
Will the FED once again try to reduce their holdings? Will Summer doldrums drag the market down or will FED holdings continue to prop up the market until after the Election? What are the long term effects of the FED holding such a large portion of the market’s liquidity? Will it cause market inefficiencies like other Government interference in the market does? Will pumping money into the market instead of into the economy directly avoid hyperinflation? Or will the prophecy come true and hyperinflation strike the U.S. economy? At this point, it seems I have more questions than answers.
You Might Also Like:
- How the Economy Works
- Inflation: The Hidden Tax
- 5 Reasons to Invest In Gold
- How the FED Controls the Money Supply
- Does the FED Control Mortgage Rates?
- Imports, Exports, and Exchange Rates
- Will the $2 Trillion Covid-19 Stimulus Cause Inflation?
- Inflation Expectations and the Massive FED Stimulus

Leave a Reply