
Historically, Stocks tend to soar in years when inflation is falling. But typically, inflation doesn’t fall until the fed-funds rate rises above the current inflation rate… The last data we have as of this writing is that inflation was 6.45% in December, and the FED funds rate was 4.1%. That is still a significant gap. But inflation is already falling.
Monthly inflation began a dramatic slowdown last July. Monthly inflation has fallen by 80% over that timeframe (bringing annual inflation down by 33%). At this point, the majority of our annual inflation occurred during the first six months of 2022.
January through June of 2022 had an average of 1.02% inflation per month. The second 6 months (on the other hand) averaged only 0.03%, with 4 of those months being negative. Negative monthly inflation (i.e., disinflation) means that the average of all prices was actually lower than the month before. But just like a negative month can drag down the annual average, a negative component (like oil/gas) can drag down the monthly average. (More on this later).
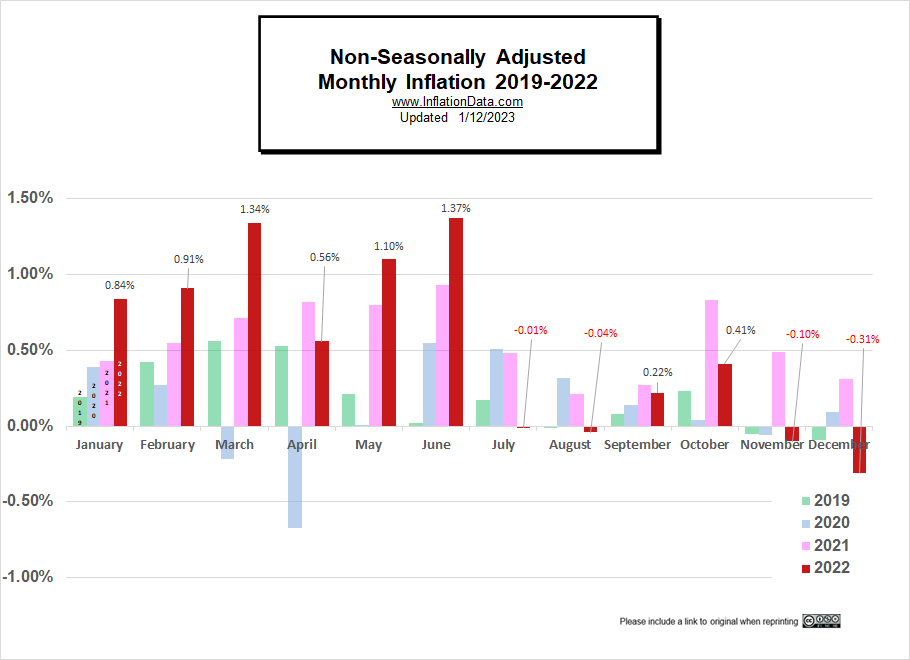
Looking at the chart above, we can see that the red lines are huge in the first half of the year and much smaller (or negative) in the second half.
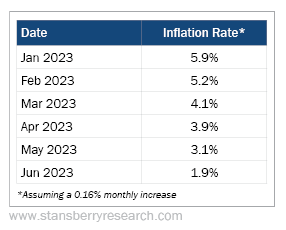
Typically, the first quarter has the majority of the inflation for the entire year, with the fourth quarter often being negative (thus erasing part of the annual inflation). So, we can’t expect an exact repeat of the fourth quarter numbers for the next quarter, but assuming that the next six months have a more typical 0.16% average monthly increase, we can expect the Annual Inflation rate to take a drastic nosedive as the huge 2022 monthly numbers fall out of the calculation. The following table by Stansberry Research shows what happens.
Our Moore Inflation Predictor is a little less optimistic, but our extreme low does still hit 2% in June:
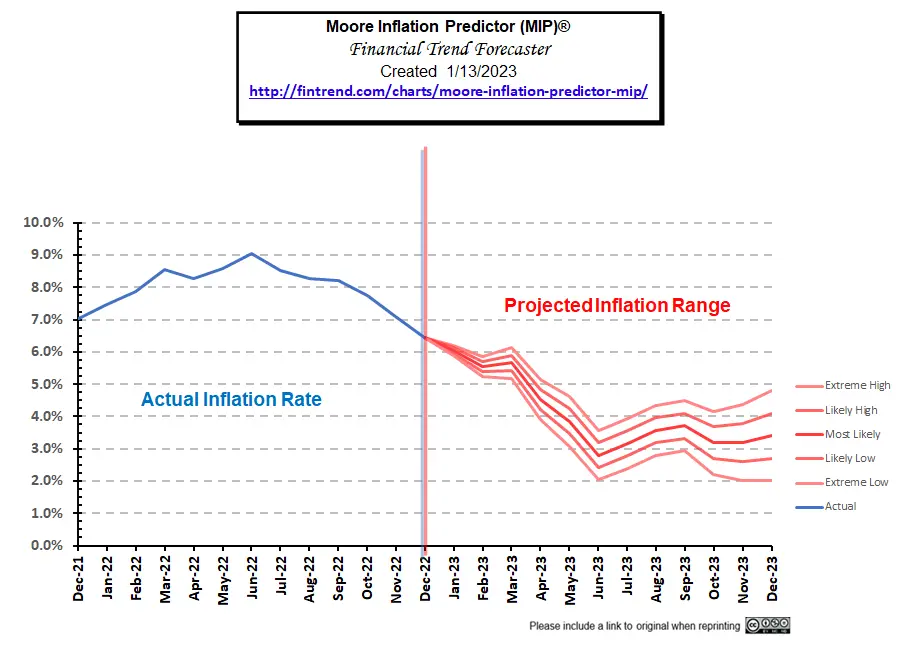 Either way, even if the FED doesn’t have any additional rate increases, long before June, the FED Funds rate will be above the annual inflation rate (i.e., the crossover). And this is bullish for stocks. The current swift drop in inflation prior to the crossover is not typical for inflation and demonstrates the unusual nature of this particular round of inflation. As we’ve said before, this inflation resulted not only from the massive increase in the money supply but also from the supply disruptions due to COVID and China’s zero Covid policy. That policy ended abruptly several months ago, and supplies are zooming. The only “fly in the ointment” is that gas prices were artificially held down by the release of crude from the strategic petroleum reserves. So, when this factor is removed, inflation could blip up again as gas/oil prices always tend to severely impact the overall inflation rate. In addition, the FED is removing liquidity from the market via Quantitative Tightening, which could still adversely affect stock prices. See Why the Fed Is Bankrupt and Why That Means More Inflation for more information.
On January 23rd, we wrote Has The Stock Market Turned Positive? discussing some of the other indicators pointing to the possibility of a bullish scenario. And on January 13th, we shifted our NYSE Rate of Change indicator from Sell to Hold, indicating the possibility of “green shoots” in the market.
You might also like:

Leave a Reply