
The Bureau of Labor Statistics (BLS) released their monthly Consumer Price Index (CPI-U) and Inflation report for the year ending in August on September 16th. The CPI index fell slightly from 238.654 in July to 238.316 in August resulting in monthly deflation but Annual Inflation for the year ending in August was 0.20% up from 0.17% for the year ending in July. That means that something that cost $100 a year ago would cost $100.20 today. That is compared to the typical inflation of around 3% which would mean that something that cost $100 last year would cost $103 this year.
The CPI-U index a year ago was 237.852 and is currently 238.316.
On an Annual basis Energy fell 15.0% over the year while food rose a scant 1.6% and all other items excluding food and energy rose 1.8%. Some standout gainers were Motor Vehicle insurance at 5.4%, rent at 3.6%, tobacco at 3.8%and medical commodities at 3.4%.
The entire 4th quarter of 2014 was deflationary with October at -0.25% in one month, then November racked up a whopping -0.54%, and December tacked on another -0.57%. And to top it all off the normally highly inflationary January (2015) came in deflationary instead at -0.47%. Although the fourth quarter will probably be deflationary this year as well if it isn’t we could see a rapid increase in the Annual inflation rate as the 2014 numbers are replaced. However, August 2015 itself was -0.14% which was very similar to August 2014 which was -0.17%.
The four months from October through January resulted in -1.83% deflation. However, the months of February through May were highly inflationary and they just about cancelled out the previous deflation.
Annual Inflation
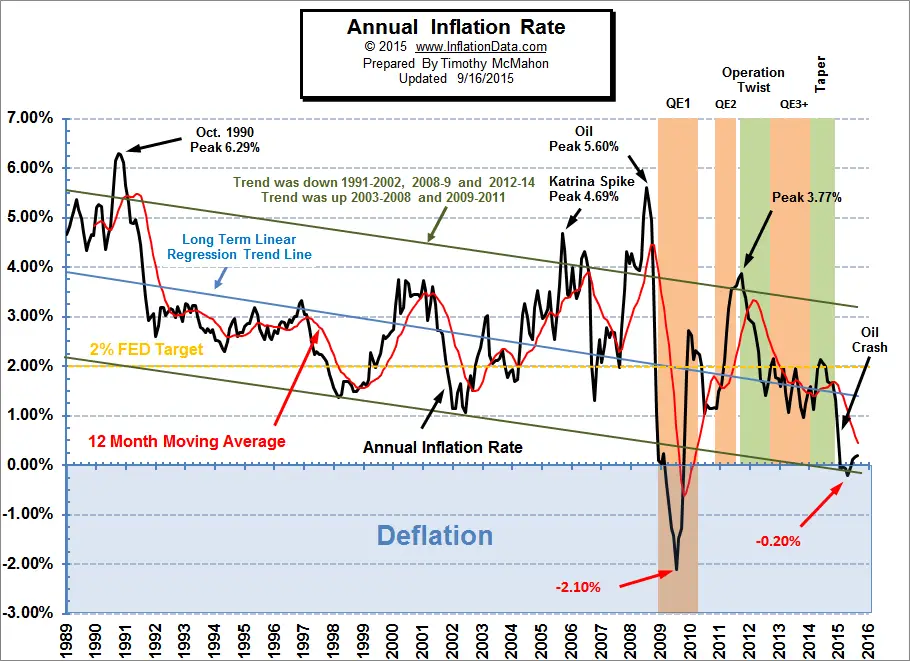 Our Annual Inflation Chart shows how small the current blip is with three months barely visible above the zero line. We can also see how small the deflation was with Annual inflation in the last five months going from -0.20% to +0.20%.
Stock Market Wisdom
History shows that many investors will hold stocks all the way down. See:
- Why Investors Cling to Hope Amid Stock Market Turmoil
- Improving Your Investments with Decision Theory
NYSE ROC
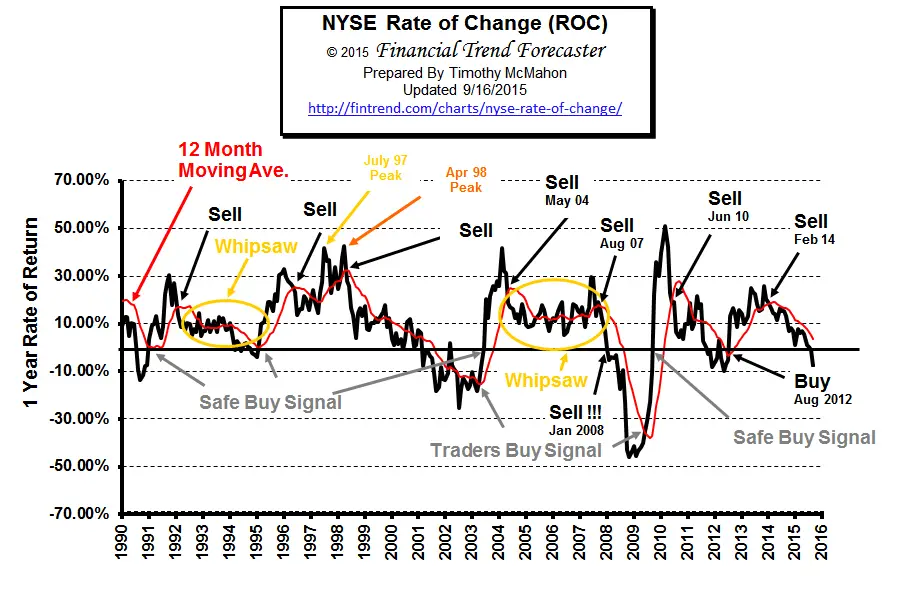 Unless you’ve been living under a rock you know that most markets including the NYSE took a major tumble earlier this month. On August 17th the NYSE closed at 10,818 and by August 25th it had fallen to 9,692 for a loss of 10.4% in just over a week. Fortunately, it has rebounded a bit since then and as of this writing stands at 10,105. This is still down 6.36% since last month and 7.96% since a year ago. If you had exited the market on February 2014 when the ROC generated its sell signal you would have been out at around 10,254 and could have been safely invested in some sort of fixed income investments.
If you had earned 2% per year over the last 18 months your investments would currently be the equivalent of NYSE 10,561. Interestingly, the peak way back in 2007 was…
See the New York Rate of Change chart for more info.
NASDAQ ROC
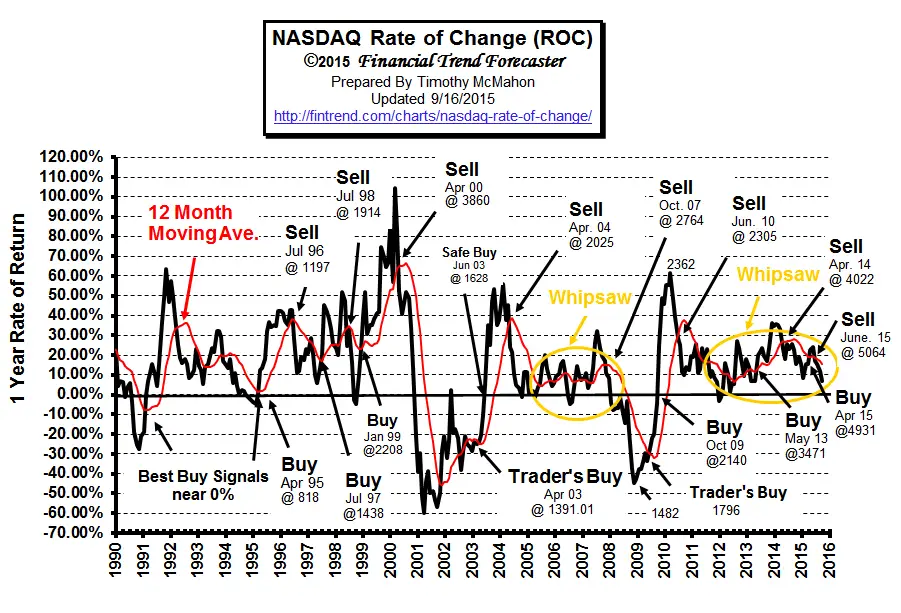 The NASDAQ index fell -3.93% over the previous month and the annual rate of return fell from 11.75% to 6.76% last month. This is still a respectable rate of return and considerably better than the NYSE which is currently looking at a year-over-year LOSS of -7.96%. But because the NASDAQ rate of return continues…
Inflation Projections
 Our Moore Inflation projection (MIP) continues to perform well and is projecting a an increase in inflation into year end with a major increase in January 2016, if it holds to the typical pattern of high inflation in the first month of the year.
Currently the Moore Inflation Predictor is projecting a rebound in inflation up to the 1.5% range near year end.
For more information see Inflation Forecast.
Misery Index
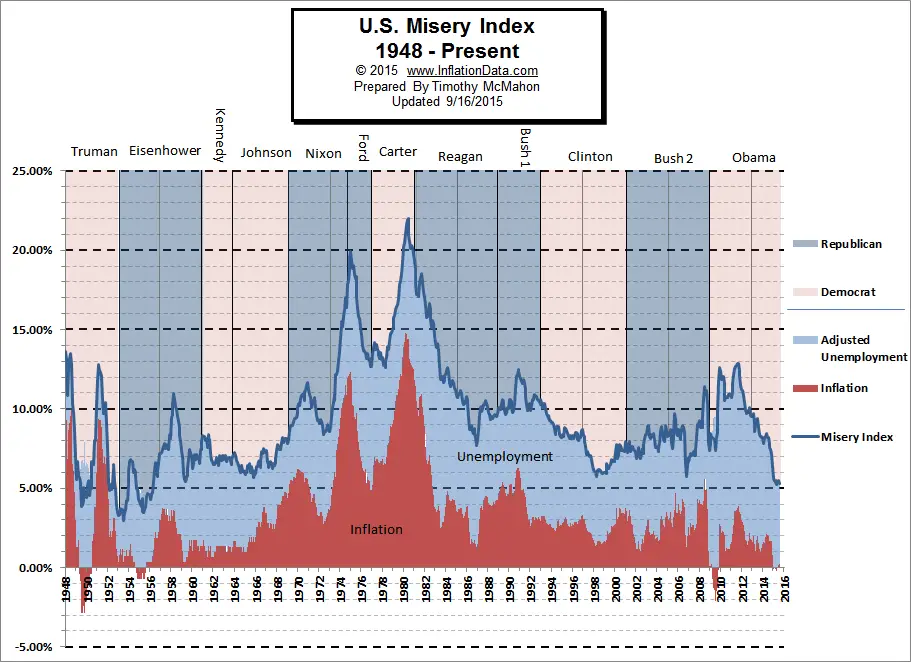 The misery index as of September 2015 (based on the most recent official government data for August 2015) is at 5.3% (5.1% unemployment and 0.20% inflation) down from a peak of 12.87% in both October and November 2011.
You might also like:
- OPEC Self-Destruction Thanks To Saudi Oil Strategy?
- Markets Crashing, Gold Rising
- 3 Powerful Trends Influencing Europe’s Financial Market Recovery
- US Consumer Spending vs. FED Inflation Decision

Leave a Reply