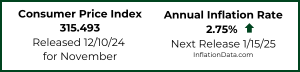
The Bureau of Labor Statistics reported that Annual Inflation fell from 6.41% in January to 6.04% in February
Monthly inflation was 0.56% for February 2023, compared to 0.91% in 2022.
Despite the significant drop in inflation the market was more concerned with bank failures so, there was no inflation rally.
February Inflation Summary:
- Annual Inflation fell from 6.41% to 6.04%
- CPI Index rose from 299.170 to 300.840
- Monthly Inflation for February was 0.56%
- Next release April 12th 2023
| Jan | Feb | Mar | Apr | May | June | July | Aug | Sep | Oct | Nov | Dec | |
| 2022 | 7.48% | 7.87% | 8.54% | 8.26% | 8.58% | 9.06% | 8.52% | 8.26% | 8.20% | 7.75% | 7.11% | 6.45% |
| 2023 | 6.41% | 6.04% |
NYSE & NASDAQ ROC – Generated a Buy Signal in January, but…
Over the last few months, the BLS inflation report has been a major factor in the stock market movements. Meanwhile, every word of the FED Chairman is dissected, looking for hints on how the FED will affect the market next. But this month, it seems like the inflation report was virtually ignored.
The NASDAQ ROC is still firmly in Buy territory, but the NYSE ROC is a bit more ambiguous. However, there is much to discuss regarding the market prospects and bank failures. With three strong support lines below current NYSE levels, we are still cautiously optimistic, but it is very important that you read the full NYSE ROC commentary to get the whole picture.
BLS Commentary:
The BLS Commissioner reported “The Consumer Price Index for All Urban Consumers (CPI-U) rose 0.4 percent in February on a seasonally adjusted basis, after increasing 0.5 percent in January, the U.S. Bureau of Labor Statistics reported today. Over the last 12 months, the all items index increased 6.0 percent before seasonal adjustment. The index for shelter was the largest contributor to the monthly all items increase, accounting for over 70 percent of the increase, with the indexes for food, recreation, and household furnishings and operations also contributing. The food index increased 0.4 percent over the month with the food at home index rising 0.3 percent. The energy index decreased 0.6 percent over the month as the natural gas and fuel oil indexes both declined.”
On an annual (non-adjusted) basis, inflation fell roughly 4/10ths of a percent from 6.41% to 6.04%.
The reason the Commissioner blames the rise on shelter costs is that shelter makes up a fairly significant portion of the total CPI, i.e., 34.413% of the total index. Of that, roughly 4% is due to household energy usage, so had energy prices not declined, shelter costs would be even higher.
To see the entire percentage breakdown of the CPI go ,here.
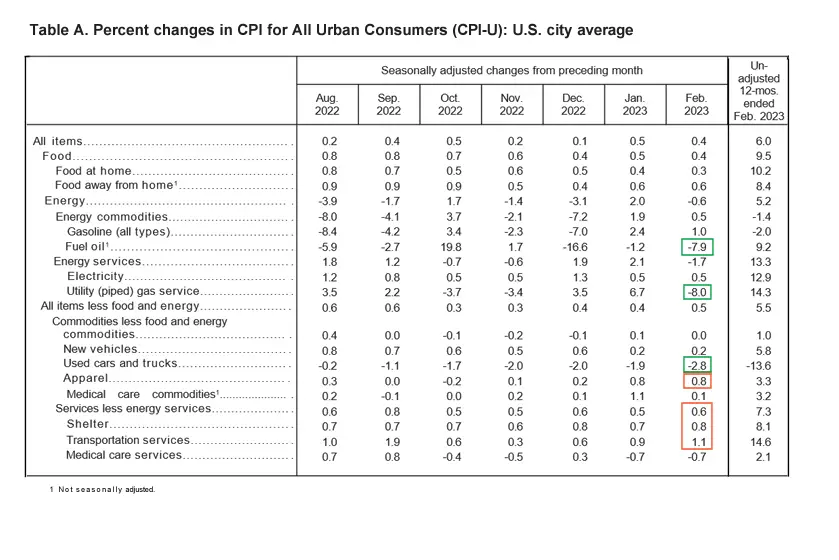
The following table shows both the good (green) and bad (red) components of the February monthly data. On an annual basis, shelter is up 8.1%. Food is up 9.5%, which makes up a little over 13.5% of the CPI total.
BLS February Inflation Components:
Monthly Inflation Compared to Previous Years:
In the chart below, we can see how the monthly inflation compares between 2019 (light green), 2020 (light blue), 2021 (pink), 2022 (red), and 2023 (orange). We can see that virtually every month in 2021 was above the corresponding month in 2020, but in 2022, April and July-December were below 2021’s level. January 2023 was just slightly below January 2022, but February was considerably lower than in 2022.

Not Seasonally Adjusted Monthly Inflation Rates
Note: January 2022’s 0.84% was the highest January since 1990. June was the highest June since 1941 (although the first quarter of 1980 had some higher rates). Typically, June is the beginning of lower monthly rates.
| Jan | Feb | Mar | Apr | May | Jun | Jul | Aug | Sep | Oct | Nov | Dec | |
| 2016 | 0.17% | 0.08% | 0.43% | 0.47% | 0.41% | 0.33% | (0.16%) | 0.09% | 0.24% | 0.12% | (0.16%) | 0.03% |
| 2017 | 0.58% | 0.31% | 0.08% | 0.30% | 0.09% | 0.09% | (0.07%) | 0.30% | 0.53% | (0.06%) | 0.002% | (0.06%) |
| 2018 | 0.54% | 0.45% | 0.23% | 0.40% | 0.42% | 0.16% | 0.01% | 0.06% | 0.12% | 0.18% | (0.33%) | (0.32%) |
| 2019 | 0.19% | 0.42% | 0.56% | 0.53% | 0.21% | 0.02% | 0.17% | (0.01%) | 0.08% | 0.23% | (0.05%) | (0.09%) |
| 2020 | 0.39% | 0.27% | (0.22%) | (0.67%) | 0.002% | 0.55% | 0.51% | 0.32% | 0.14% | 0.04% | (0.06%) | 0.09% |
| 2021 | 0.43% | 0.55% | 0.71% | 0.82% | 0.80% | 0.93% | 0.48% | 0.21% | 0.27% | 0.83% | 0.49% | 0.31% |
| 2022 | 0.84% | 0.91% | 1.34% | 0.56% | 1.10% | 1.37% | (0.01%) | (0.04%) | 0.22% | 0.41% | (0.10%) | (0.34%) |
| 2023 | 0.80% | 0.56% |
See: Monthly Inflation Rate for more information and a complete table of Unadjusted Monthly Rates.
Inflation Forecast
Looking back at the chart we created last March (a year ago), we can see that the FED has actually beaten our most optimistic projections.
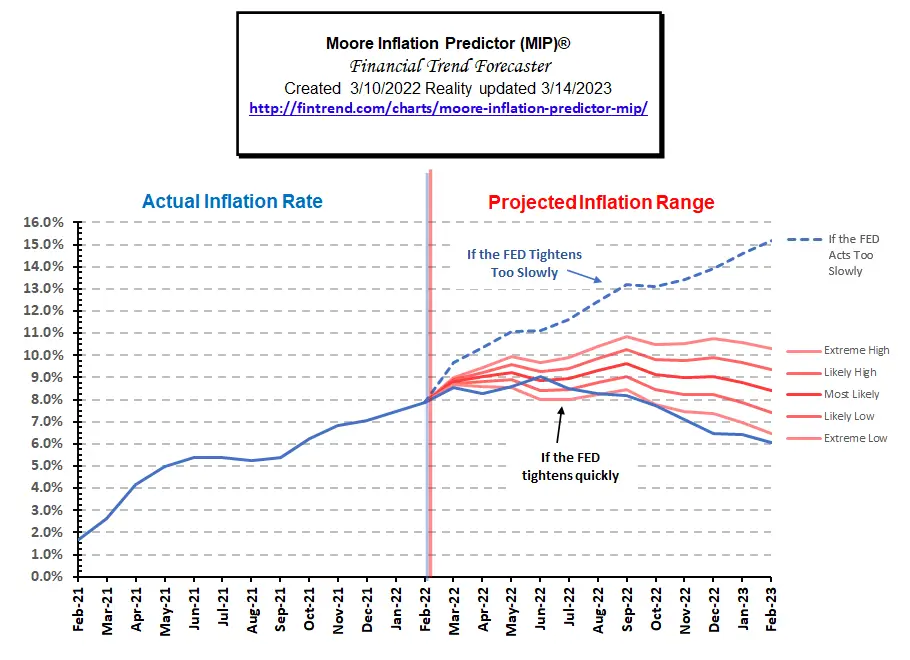
See this month’s full MIP Chart and commentary here.
Misery Index
Unemployment was up and Inflation was down.
[Read More on the Misery Index…]
Inflation-adjusted Oil Price Chart and Oil Price Table
We’ve also updated the Inflation adjusted Oil Price Chart and Oil Price Table
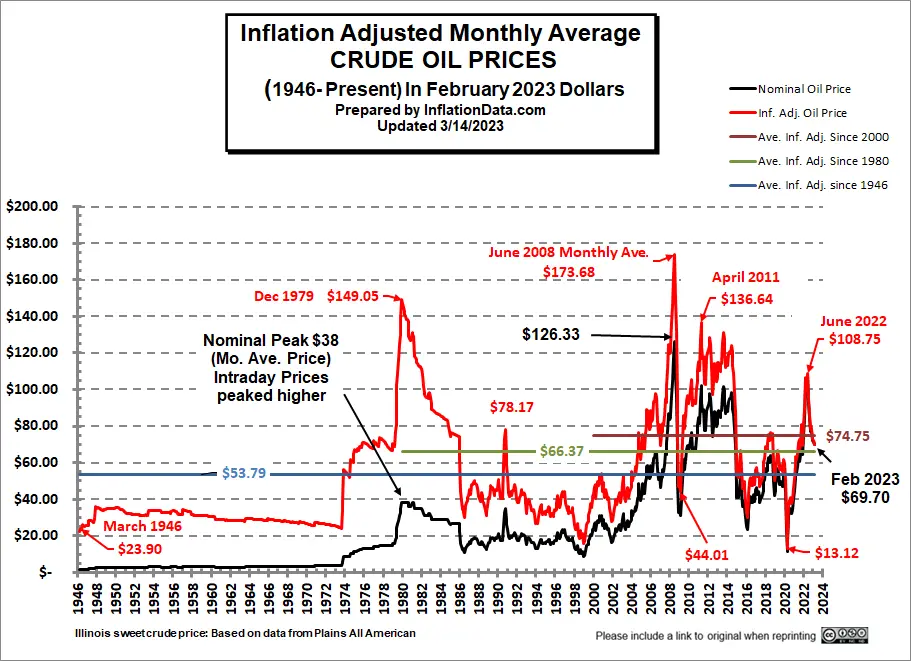
Read the full commentary here: Inflation-adjusted Crude Oil Chart and here Inflation-Adjusted Oil Prices in Table Form
You Might Also Like:
From InflationData.com
- How Loose Monetary Policies Cause Recessions
- Food and Shelter Prices Keep Climbing as CPI Growth Hits a Three-Month High
- Is The Fed Flashing Signs It’s Done Raising Rates?
- Falling Inflation is Good for Stocks
- Why the Fed Is Bankrupt and Why That Means More Inflation
From Financial Trend Forecaster
- NYSE ROC Chart
- NASDAQ ROC Chart
- More Cracks in U.S. Dollar Dominance
- Do “Red States” Ride the “Blue State” Gravy Train?
- Has the Stock Market Turned Positive?
- Are Countries Getting Smaller?
- Is the U.S. Dollar Hegemony Ending?
From UnemploymentData.com.
- 5 Must-Know Tips for Optimizing Your Job Search
- February 2023 Unemployment Report
- Why Becoming a Flooring Installer is a Stable Career Path
- Strategies for Conquering Job Search Frustration
From Elliott Wave University
- Bull Trap or Market Consolidation?
- 60% stocks, 40% bonds? Ha!
- U.S. Dollar: Has the Mainstream Been Way Too Confident?
- Banks Are Becoming More Cautious About Lending
- Are You Prepared for Widespread Bank Failures?
From OptioMoney
- How to Financially Prepare for a Baby
- 6 Ways to Cope with Bad Financial Decisions
- Simple Ways to Save Money When Shopping Online
- How to Start Saving for Your Education
From Your Family Finances
- 5 Signs You’re Due for a Bathroom Remodel
- The Secret to Why Oceanfront Homes are a Great Investment
- Top 4 Ways to Start Investing
- In-Home Nurse vs. Assisted Living Facilities: Which Is Best for Your Loved One
- 5 Ways to Receive Payment for Your Home’s Sale


Leave a Reply