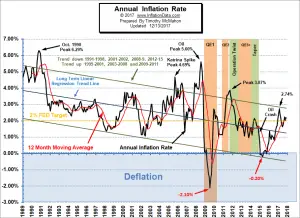
The U.S. Bureau of Labor Statistics released the Annual Inflation Rate data for the year through the end of November on December 13th 2017. Annual inflation was 2.20% in November up from 2.04% in October CPI-U up slightly from 246.663 to 246.669 Monthly Inflation for November 0.002% Next release January 12th Monthly Inflation is Essentially Zero If the annual inflation rate is negative that is called "deflation" (i.e. prices have gone down since the previous year) but whenever the monthly inflation rate is negative that is called "disinflation" (i.e. prices have gone down since the previous month). That is what happened in October 2017. This month the CPI-U … [Read more...]
Inflation Up, NYSE New High
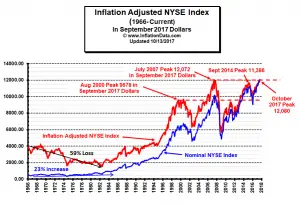
Current Inflation Situation On October 13th the Bureau of Labor Statistics released the Consumer Price Index inflation information for September. The CPI-U index was 246.819 up from 245.519 in August. This resulted in an annual inflation rate for the 12 months through September 2017 of 2.23% up from 1.94% in August, 1.63% in June and 1.73% in July. Monthly inflation was a whopping 0.53% for September primarily due to a 12% increase in gasoline prices due to refinery shutdowns in response to hurricanes. See our Annual Inflation Chart for more info. NYSE Makes New High in Inflation Adjusted Terms! To get a true picture of the state of the market it helps to look at the … [Read more...]
July CPI Down But Inflation Up
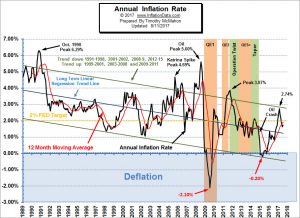
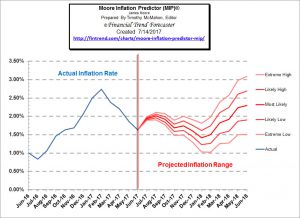
The Bureau of Labor Statistics Released the Inflation Data for the Year ending in July on August 11th. Annual inflation was 1.73% in July - Up from 1.63% in June, but down from 1.87% in May, 2.20% in April, 2.38% in March, 2.74% in February, and 2.50% in January. CPI 244.786 in July down from CPI 244.955 in June Monthly Inflation for July -0.07%, June 0.09%, May 0.09%, April was 0.30%, March was 0.08%, February was 0.31% and 0.58% in January. Next release September 14th The reason the CPI went down but inflation went up is because July 2016 monthly inflation was -0.16% and this July was less negative. So CPI goes down for the month but not as much as last year so Annual … [Read more...]
Inflation 1.63% in June
The U.S. Bureau of Labor Statistics released the Annual Inflation Rate data for the year ending in June on July 14th 2017. Annual inflation was 1.63% in June - down from 1.87% in May, 2.20% in April, 2.38% in March, 2.74% in February, and 2.50% in January. June CPI-U 244.955-- May CPI-U 244.733 Monthly Inflation for June 0.09%, May 0.09%, April was 0.30%, March was 0.08%, February was 0.31% and 0.58% in January. Next release August 11th Annual Inflation Chart Annual inflation for the 12 months ending in June 2017 was 1.63% down from 1.87% in May, 2.20% in April, 2.38% in March, 2.74% in February and 2.50% in January. The annual cyclical low was 0.84% in July 2016. The … [Read more...]
Inflation Down in May But Real Estate Booming (or is it?)
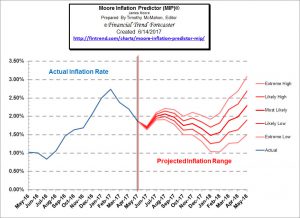
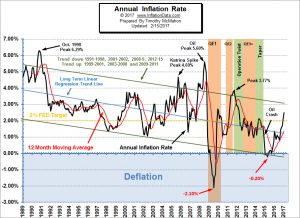
Annual inflation for the 12 months ending in May 2017 was 1.87%. Inflation has steadily moved lower month by month from its peak of 2.74% in February. First falling to 2.38% in March, then down to 2.20% in April, and finally 1.87% in May. Although Inflation has fallen it is still slightly above its 12 month moving average (Red Line) indicating that the short-term trend is still up, although the gap is closing, a cross below the moving average would indicate that the short term trend has switched to "down". Since 2008, there has been a battle between inflation and deflation with the FED fighting against deflation. In March, the FED has switched sides and is raising interest rates. … [Read more...]
Inflation Rate Falls for April
The U.S. Bureau of Labor Statistics (BLS) released the monthly and annual Inflation numbers for April 2017. Annual inflation was 2.20% down from 2.38% in March, 2.74% in February, and 2.50% in January but above the 2.07% in December. Consumer Price Index (CPI-U) 244.524 up from 243.801 in March Monthly Inflation for April was 0.30% very close to February's 0.31% and similar to the average between March's 0.08% and January's 0.58%. Next release June 14th With Inflation falling almost 2/10ths of a percent and unemployment down one-tenth of a percent the Misery Index is down 3/10ths of a percent. The misery index helps … [Read more...]
Inflation Skyrockets to 2.5% In January
Annual Inflation is up from 2.07% in December to 2.5% in January. January itself racked up a whopping 0.58% monthly inflation rate. The Bureau of Labor Statistics released the newest inflation numbers on for January on February 15th 2017. Their Consumer Price Index (CPI-U) for all Urban Consumers was 242.839 up from 241.432 in December. Annual Inflation Chart Annual inflation is up from the annual cyclical low of 0.84% in July 2016, August was 1.06%, September rose to 1.46% and October was 1.64%. This is also up from the longer term cyclical low of -0.20% in April of 2015. Although this may look like the beginning of a longer upward trend it is still possible that it is simply a … [Read more...]
July Inflation Numbers Minimal
The Bureau of Labor Statistics (BLS) released their monthly Consumer Price Index (CPI-U) and Inflation report for the year ending in July on August 19th . Annual Inflation came in at 0.17%. That means that something that cost $100 a year ago would cost $100.17 today. That is compared to the typical inflation of around 3% which would mean that something that cost $100 last year would cost $103 this year. The BLS rounds this to .2% which of course is so small that almost any one of the deflationary months last year would cancel out all the inflation we've seen over the previous 12 months. The CPI-U index a year ago was 238.250 and is currently 238.654. We have seen significant … [Read more...]
BLS Releases May Inflation Stats
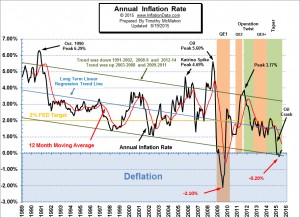
May's monthly prices increase 0.51% but the annual inflation rate was still -0.04%. The Bureau of Labor Statistics (BLS) released their monthly Consumer Price Index (CPI-U) and Inflation report for the year ending in May on June 18th. This resulted in the 5th deflationary month in a row. We have seen a steady decline in inflation rates over the last year. May 2014 started with an annual inflation rate of 2.13%. June saw annual inflation fall to 2.07% then July declined to 1.99%, August was 1.70%, then September and October were both 1.66%, November was 1.32%, and December was 0.76%. When January rolled around it was … [Read more...]

