
May’s monthly prices increase 0.51% but the annual inflation rate was still -0.04%.
The Bureau of Labor Statistics (BLS) released their monthly Consumer Price Index (CPI-U) and Inflation report for the year ending in May on June 18th. This resulted in the 5th deflationary month in a row.
Our Annual Inflation Chart shows the downward trend in inflation since the peak in October 1990 and then the rebound after the 2008 crash due to the various quantitative easing programs. The current tapering has seen inflation fall off a cliff in 2014 with a slight deflation bias for all of 2015 so far.
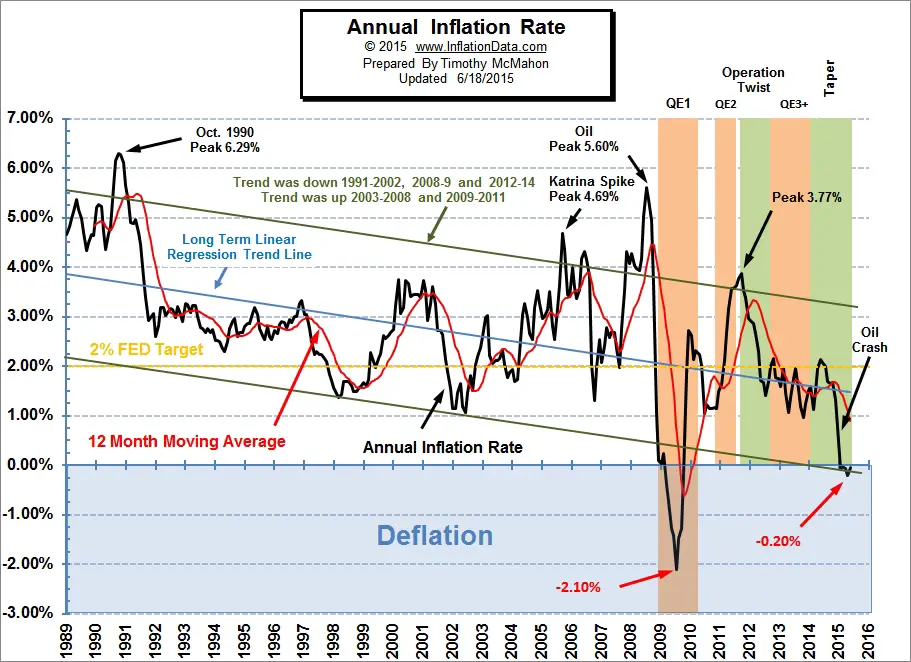
Over the last month major force was energy with Gasoline rising a seasonally adjusted 10.4% in a single month but still being down an unadjusted -25.0% for the year. Fuel Oil only rose a seasonally adjusted 0.7% for the month of May but was still down a non-adjusted -27.6% over the whole year. Natural gas was flat for the month but is still down -15.4% for the year. Food rose 1.6% for the year while Hospital services rose 4.9% but airfares fell -6.6%. All items less food and energy rose 1.7%.
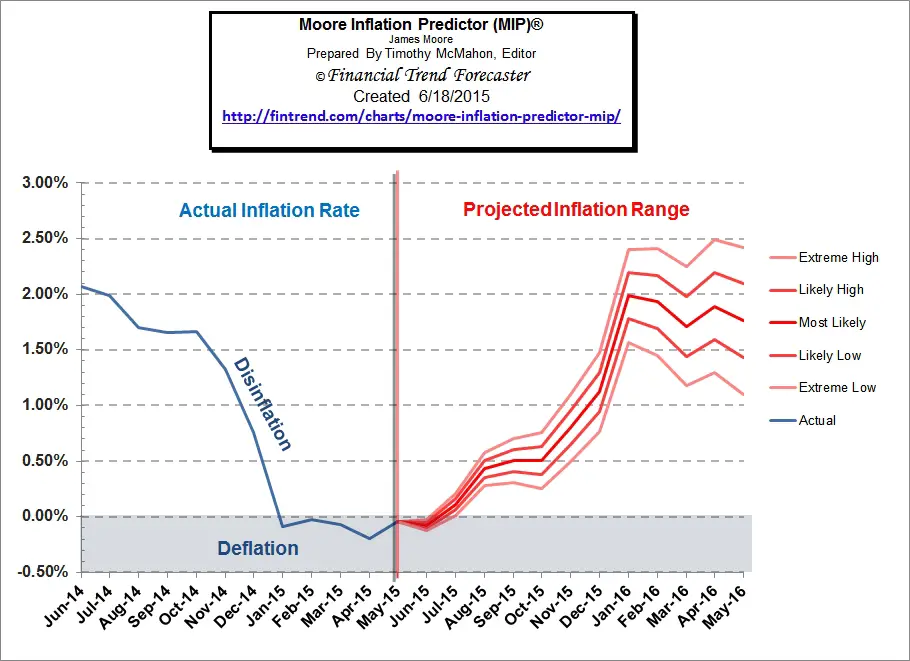
Inflation Projections
Our Moore Inflation projection (MIP) continues to perform well and is projecting a flat to down month followed by a rise into year end. The new year should see some moderation however.
Misery Index
The misery index as of June 2015 (based on the most recent official government data for May 2015) is at 5.46% (5.5% unemployment and -0.04% inflation) down from a peak of 12.87% in both October and November 2011 which was pretty miserable.
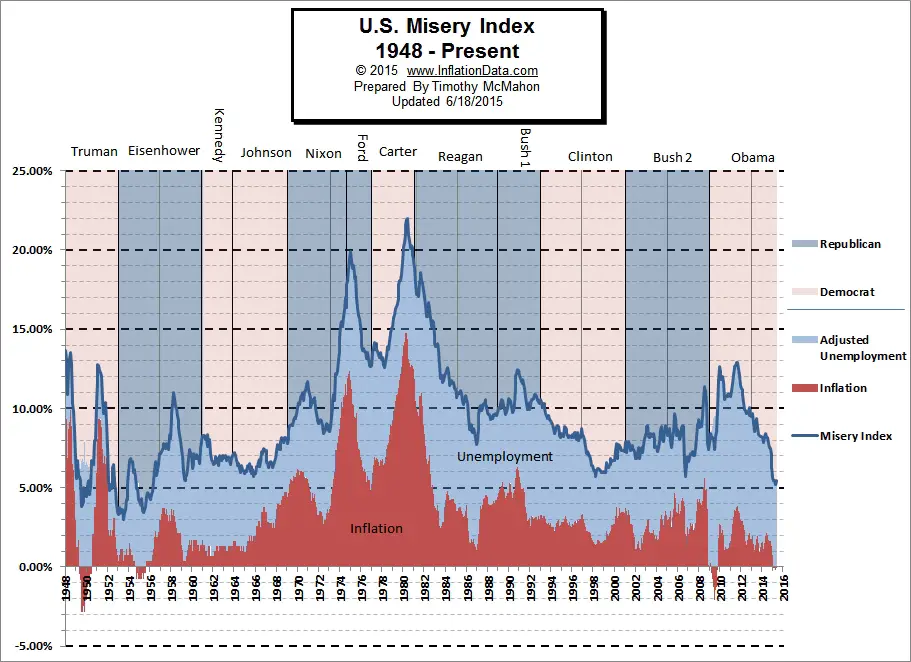
Note: During times of deflation (i.e. negative inflation) the misery index might not be truly representative of the actual misery of the general population. Although falling prices can help alleviate suffering, deflation does not necessarily guarantee “good times” if that were the case the “Great Depression” would have to be renamed “Happy Days” since prices fell 9% in 1931 and then another 10% in 1932. See: The Great Depression The Deflationary 1930′s– 1930-1939. Even though the “Roaring 20’s” had massive deflation not everyone benefited. Those in the cities prospered but farmers suffered severely as the prices of their produce fell drastically in 1921 and 1922. See The “Roaring Twenties” Inflation and Deflation 1920-1929 .
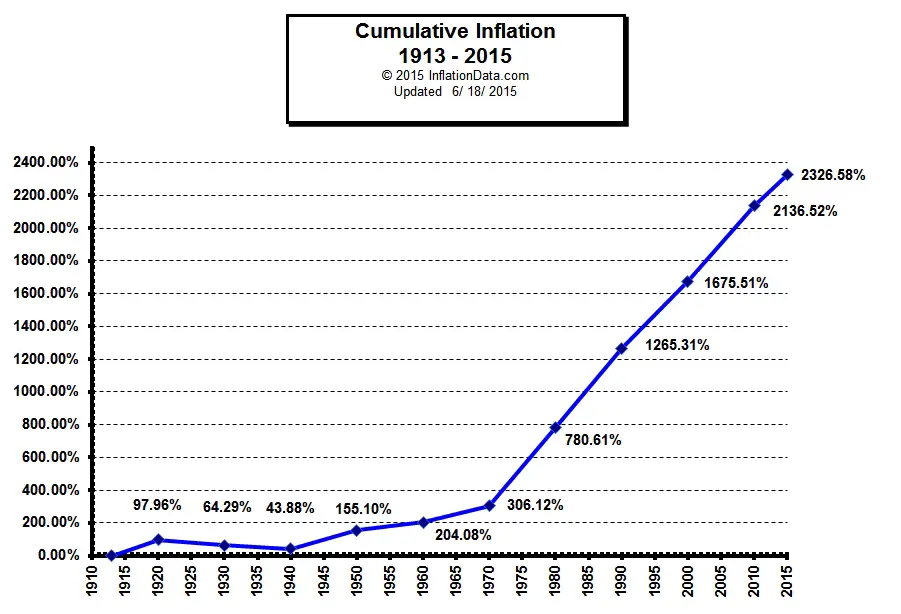
Cumulative Inflation
This month we’ve updated our cumulative inflation chart showing the total inflation since 1913 when the BLS began tracking it. It has reached the astronomical level of 2326.58%. That means that something that cost $100 in 1913 would now cost $2426.58!
See Also:
 |
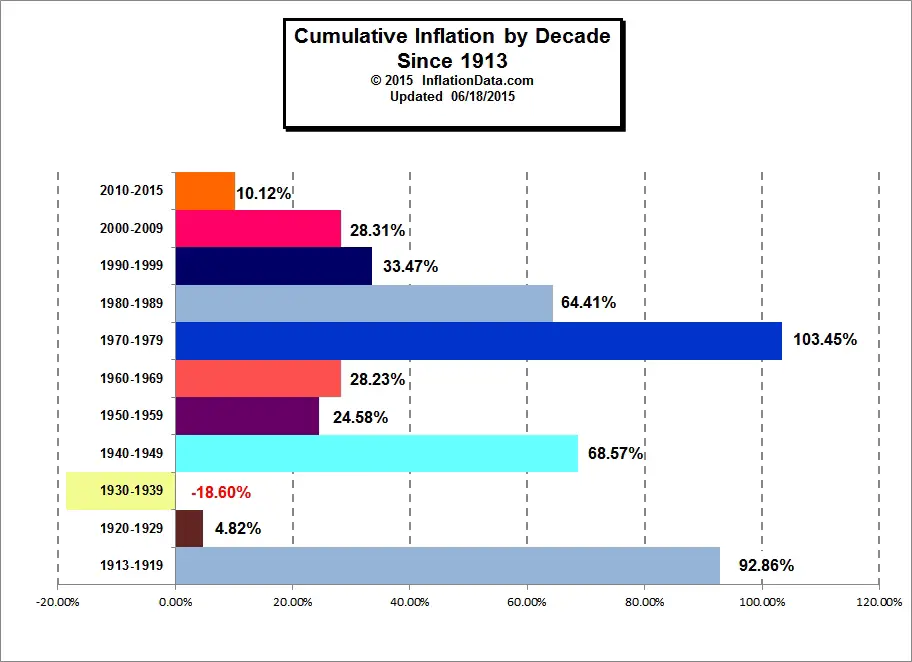 |
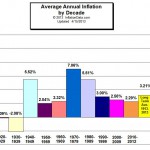
| Average Annual Inflation by Decade | Total Inflation by Decade |
- Inflation and Consumer Price Index- Decade Commentary
- WWI – The beginning of the of the CPI the Inflationary period 1913 – 1919
- The “Roaring Twenties” Inflation and Deflation 1920-1929
- The Great Depression and the Deflationary 1930′s– 1930-1939
- World War II — the volatile 1940′s– High and Low Inflation 1940-1949
- The 1950′s “Happy Days”– Inflation and CPI 1950-1959
- The 1960′s the age of possibility– Low Inflation 1960-1969
- The Inflationary 1970’s Inflation and CPI 1970-1979
- The Reagan Era Lower Inflation 1980-1989

Leave a Reply