
Annual Inflation is up from 2.07% in December to 2.5% in January. January itself racked up a whopping 0.58% monthly inflation rate. The Bureau of Labor Statistics released the newest inflation numbers on for January on February 15th 2017. Their Consumer Price Index (CPI-U) for all Urban Consumers was 242.839 up from 241.432 in December.
Annual Inflation Chart
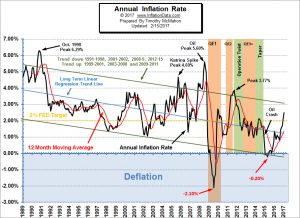 Annual inflation is up from the annual cyclical low of 0.84% in July 2016, August was 1.06%, September rose to 1.46% and October was 1.64%. This is also up from the longer term cyclical low of -0.20% in April of 2015.
Although this may look like the beginning of a longer upward trend it is still possible that it is simply a function of the cyclical rise since inflation is still below the upper limit of the downward trend line. For more information see: Annual Inflation Chart.
Misery Index
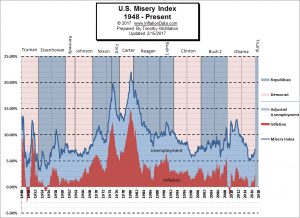 With inflation climbing sharply it is also dragging the Misery index with it. The Misery index is the combination of inflation and unemployment. Both climbed during January although this is quite common for the first quarter as retailers lay off seasonal employees. However, since the Misery Index uses the seasonally adjusted unemployment rate the majority of the current spike came from the increase in the inflation rate.
The misery index as of January 2017 (based on the most recent official government data for the 12 months ending in December) is at 6.77% (4.7% unemployment and 2.07% inflation) up from last month’s 6.29% but well below the peak of 12.87% in both October and November 2011. For more information see Misery Index.
Moore Inflation Predictor (MIP)
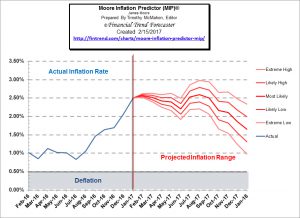 The Moore Inflation Predictor was predicting a sharp rise in the inflation rate last month but wasn’t expecting it to reach 2.5% until February but inflation spiked sharply last month reaching our target a month early. See what the Moore Inflation Predictor is forecasting now.
Current NYSE-ROC Analysis:
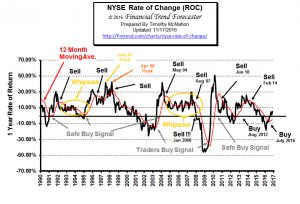 BUY Signal Continues!
A buy signal was generated in July 2016 and the ROC continues upward…
This month the monthly rate of return was 1.81% up from 0.64% last month. The annual rate of return shot up to over 26% up from 22% last month. This is primarily because last year the market tanked in January (-8.3%) and lost another (-1.4%) in February. But last March saw a major rebound so we expect the Annual rate of return to drop even if the market itself stays steady.
See: NYSE Rate of Change for more info.
Current NASDAQ-ROC Analysis:
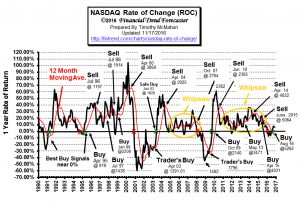 BUY Signal Continues!
The NASDAQ index increased 3.6% since last month on top of 2.18% the previous month. but since there was a sharp drop last January, February and March the NASDAQ is currently a whopping 27% above year ago levels. Consequently, it remains well above its moving average. Thus maintaining a buy signal, however this is getting toward “nosebleed” territory so caution should be observed.
See: NASDAQ Rate of Change for more info.

Leave a Reply