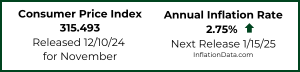
The U.S. Bureau of Labor Statistics released the Annual Inflation Rate data for the year through the end of November on December 13th 2017.
- Annual inflation was 2.20% in November up from 2.04% in October
- CPI-U up slightly from 246.663 to 246.669
- Monthly Inflation for November 0.002%
- Next release January 12th
Monthly Inflation is Essentially Zero
 If the annual inflation rate is negative that is called “deflation” (i.e. prices have gone down since the previous year) but whenever the monthly inflation rate is negative that is called “disinflation” (i.e. prices have gone down since the previous month). That is what happened in October 2017. This month the CPI-U increased minimally from 246.663 to 246.669 this resulted in a monthly inflation for November of 0.002%. Less than we normally measure. However, despite zero monthly inflation, the annual inflation rate increased from 2.04% in October to 2.20% in November.
You might be wondering, how is this possible? The answer is that the annual inflation rate is made up of 12 monthly components and November 2016 was a disinflationary -0.16% so when that negative number fell out of the calculation and was replaced by essentially a zero, so the overall total actually increased by 0.16% taking it from 2.04% to 2.20%.
Typically the months of October through December produce the lowest increase in prices and are often disinflationary.
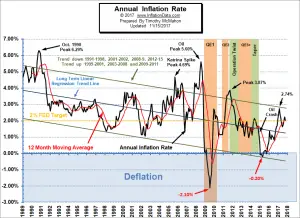
See Annual Inflation Chart for more info.
According to the U.S. Bureau of Labor Statistics (BLS) commissioner’s report-
“The Consumer Price Index for All Urban Consumers (CPI-U) rose 0.1 percent in October on a seasonally adjusted basis, the U.S. Bureau of Labor Statistics reported today. Over the last 12 months, the all items index rose 2.0 percent. The shelter index increased 0.3 percent and was the main factor in the seasonally adjusted all items increase. The energy index fell, as a decline in the gasoline index outweighed increases in other energy component indexes. The food index was unchanged over the month.”
How Oil Prices Affect Inflation
For a very long time, the prices of oil and inflation have been closely related to each other. When the value of the precious black liquid goes up, inflation follows in the same direction. The reason for this is because oil is a major commodity that’s linked to a lot of things. Oil is used to heat homes, power public utilities, as well as run factories it is also a direct component in things like plastics. That being said, if the input cost for oil rises, so will the costs of finished products and services.
The direct association between oil and inflation was first recorded in the 70s. It was at the time when the cost per barrel rose from $3 in 1973 to $40 in the 1979 oil crisis. This allowed the Consumer Price Index (CPI) — the primary measurement of price inflation — to double from 41.20 to 86.30 in 1980. Because of the major influence of oil, the Bureau of Labor Statistics began publishing a version of the Consumer Price Index (CPI) both with and without energy so those who were interested in comparing could see the effects of oil price increases as a separate index.
For more information see:
Misery Index
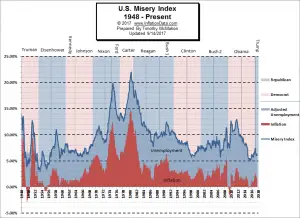 The misery index as of December 2017 (based on the most recent official government data for the 12 months ending in November) is at 6.30% (4.1% unemployment and 2.20% inflation) down from 6.43% in September but above the 6.03% in June and July. With inflation up and unemployment flat for the month, the Misery index is well below the February peak of 7.44%.[Read More…]
Moore Inflation Predictor
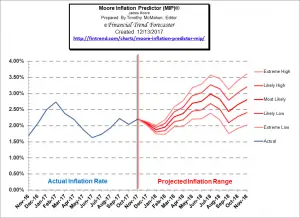 Last month our MIP Chart was projecting a “flat to up move taking the Annual inflation rate up slightly”. That is precisely what happened. Annual Inflation was 2.04% last month and it is 2.20% this month. This month, the MIP is projecting a down move possibly taking the Annual inflation rate back below 2% next month but then rising again after February.
See Moore Inflation Forecast for more info.
NYSE Rate of Change (ROC)©
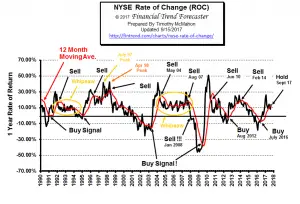 Although the NYSE index was above its moving average last month, this month it has moved below. Moving us into technical Sell territory. However at this point in the cycle we could very well be seeing a whipsaw and with the annual rate of return at 14% we wouldn’t jump to sell too quickly.
See what the falling NYSE ROC means for you now.
NASDAQ Rate of Change (ROC)©
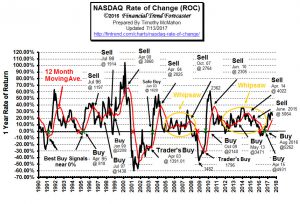
Hold Signal! Acceleration to the upside peaked in April and is currently barely above the moving average.
See NASDAQ ROC for more.
You Might Also Like:
From Financial Trend Forecaster
- Brexit and House Prices – What’s going on?
- Is Peak Permian Only 3 Years Away?
- The 5 Countries That Could Push Oil Prices Up
- Catalan: Independence or Revolution?
- Stocks Still Have Strong Low-Inflation/Low-Rates/Improving-Economy Tailwind
- Bitcoin Trends
From Unemployment Data
- Why Criminal Justice Careers are Perfect for Military Veterans
- Job Transition: 4 Keys to Starting a Career in a New Field
- Manufacturing Jobs Soar Under Trump
- Moving on After Being Laid Off: How to Gain Back Confidence
- 5 Tips for Starting Your Own Moving Company
From OptioMoney
- Financial Figures: How to Budget for a Mortgage
- Finding Creative Ways to Save
- 5 Ways to Make and Save Money Using Pinterest
- 4 Life-Changing Events that Could Tank Your Finances
- Broken Cars, Broken Bones, and Broken Finances: How to Manage Your Money after an Accident
From Elliott Wave University
- U.S. Stocks: A Sentiment Extreme You MUST Pay Attention to
- 12 Real-Life Techniques That Will Make You a Better Trader Now
- Did You See the 30% Rise in This Major Global Stock Index?
- Silver Chart of the Day
- Gold: Often, Simple Forecasting Tools Are All You Need
From Your Family Finances
- Looking To Invest? Bonds To Consider
- Parent Problems: 4 Thrifty Ways to Prepare Yourself for Teenagers
- 4 Factors That Determine Your Personal Injury Case’s Worth
- Going from Zero to 720 Credit Score in One Year
- Creating Business Opportunities


Leave a Reply