
The U.S. Bureau of Labor Statistics released the Annual Inflation Rate data for the year ending in June on July 14th 2017.
- Annual inflation was 1.63% in June – down from 1.87% in May,
2.20% in April, 2.38% in March, 2.74% in February, and 2.50% in January. - June CPI-U 244.955– May CPI-U 244.733
- Monthly Inflation for June 0.09%, May 0.09%, April was 0.30%, March was 0.08%, February was 0.31% and 0.58% in January.
- Next release August 11th
Annual Inflation Chart
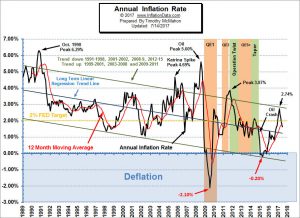
Annual inflation for the 12 months ending in June 2017 was 1.63% down from 1.87% in May, 2.20% in April, 2.38% in March, 2.74% in February and 2.50% in January. The annual cyclical low was 0.84% in July 2016. The longer term cyclical low of -0.20% was in April of 2015.
We have to remember that typically the months of January through May are highly inflationary, June through September are moderately inflationary and October through December produce the lowest increase in prices and are often even deflationary. However, this year the high inflation months have not produced as much annual inflation as usual and if we only look at the last few months, it looks like inflation is falling. See Annual Inflation Chart for more info.
Is A Big Move In Oil Prices Due?
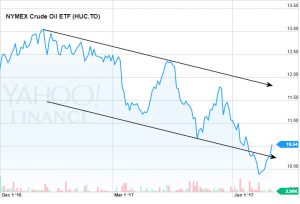 On November 30th 2016, Bloomberg trumpeted the following headline, OPEC Confounds Skeptics, Agrees to First Oil Cuts in 8 Years. On the day before, (i.e. November 29th) oil prices had plunged 2.5% and the NYMEX Oil ETF was trading at $11.34 and the news drove the price up to $13.05 by January 6th, 2017 where it peaked and it’s been downhill ever since.
Are Regulations Strangling Free Enterprise?
On July 17, 2014 Eric Garner died due to a police officer’s “choke hold”. This made big news but what made barely a ripple was his “crime”. What was his crime? It was simply selling “unlicensed … [Read More…]
Will Solar Energy Finally Catch On?
The idea of using solar power is a popular one. Not only is it eco-friendly, but the hope is that it can also save your household a significant amount of money. But the idea of using solar power is … [Read More…]
Moore Inflation Predictor
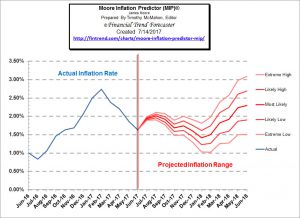 Last month we said that “the MIP is projecting that June will be another down month”. So we hit the nail on the head again.
This month, the MIP is projecting an upturn for a couple of months and then we may see another slight downturn.
See Moore Inflation Forecast for more info.
NYSE Rate of Change (ROC)©
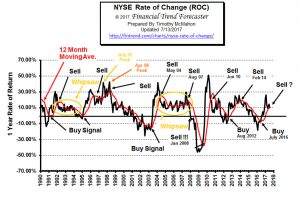 The NYSE Rate of Change (ROC) chart is helpful in getting the “big picture” of the stock market very quickly. The old saying “a picture is worth a thousand words” is very applicable to this chart. Once you understand how to read the ROC chart you can easily spot the direction of the market which makes it easy for you to know whether you want to be invested in the market or not.
See what the NYSE Rate of Change is saying now.
NASDAQ Rate of Change (ROC)©
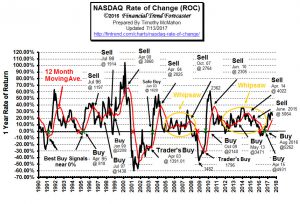 In April the NASDAQ index fell –0.88% since then the NASDAQ has rallied with a vengeance. It gained 5.36% in May, 1.71% in June and another 0.87% in July Annual returns in June were 28.65% but it has fallen to 24.75% in July.
I’ve been saying for a while, “As we’ve seen before a spike from below zero can peak quickly and then generate a “sell signal” but it can stay in “whipsaw territory” for a while and this period can still generate healthy returns for quite some time.” At this point the index is still well above the moving average. If it crosses below we will have a technical Sell signal … See NASDAQ ROC for more.
You Might Also Like:
- Safe Summer: 3 Ways to Protect Your Kids from Recreational Injuries
- Poor Credit Got You Down? Try This…
- How to Create the Ideal Home Office You’ll Enjoy Working In
- Modern Housing Hacks to Get a New House- Cheap
- Landscaping the Perfect Yard on a Budget
- Why 80 Percent of Americans Shop Online
- 5 Tips to Consider When Purchasing Your First Home
- How to Navigate Through the Emotional Baggage of Bankruptcy
- Plastic Money: Top Tips for First Time Credit Card Holders
- Guide to Turning Your Short-Term Savings into Long-Term Investment
- 6 Things to Consider When Your Business Expands
- 45 Ways You Can Find Success Without a Degree
- Choosing Your College Major and the Best Career Path
- Deciding Which Engineering Degree is Right for You
- Crude Oil Sinks 20% Despite OPEC Production Cuts
- How Concerning Are Predictions Of A Stock Market Crash?
- The Silver/Gold Ratio, Inflation/Deflation and The Yield Curve

Leave a Reply