• Home
  • Related Sites
    • Financial Trend Forecaster
      • Moore Inflation Predictor
      • NYSE Rate of Change (ROC)
      • NASDAQ Rate of Change (ROC)
      • Crypto ROC- BTC & ETH
    • Unemployment Data
      • Historical Employment Data
      • Unemployment Rate Chart
      • Labor Force Participation Rate
    • Optio Money
    • Elliott Wave University
    • More Resources
  • Definitions
    • What is Inflation?
    • What is Core Inflation?
    • Inflation vs CPI
    • What is Deflation?
    • What is Disinflation?
    • What is Agflation?
    • What is Stagflation?
    • What is Hyperinflation?
    • What is Quantitative Easing?
    • What is Quantitative Tightening?
    • What is Velocity of Money?
    • What is Fiat Currency?
    • How Do I Calculate Inflation?
    • What are “Sticky Prices” and Why Do They Matter?
  • Featured Content
  • About Us
  • Feedback
    • Sitemap
  • Subscribe Now

InflationData.com

Your Place in Cyber Space for Inflation Data

  • Numerical Inflation Data
    • Current Inflation Rate
    • Monthly Inflation Rate (Moved)
    • Historical U.S. Inflation Rates
    • Historical CPI
  • Inflation Charts
    • Ann. Inf. Rate Chart
    • Long Term Inflation >
      • Ave. Inf. by Decade
      • Total Inf. by Decade
      • Inflation 1913-1919
      • Inflation 1920-1929
      • Inflation 1930-1939
      • Inflation 1940-1949
      • Inflation 1950-1959
      • Inflation 1960-1969
      • Inflation 1970-1979
    • Cumulative Inflation
    • FED Monetary Policy and Inflation
    • Inflation and Recession
    • Confederate Inflation (1861 – 1865)
    • Misery Index
    • The 3 Stages of Inflation
    • 15-Yr Inflation Trends Chart
  • Inflation Calculators
    • Cumulative Inf. Calc.
    • How Much Would it Cost
    • Historical Inflation Calculator since 1774
    • Salary Inf. Calc.
    • U.K. Inf. Calc.
    • Cost of Gas Calc.
    • Net Worth Calc.
    • Lifetime Earnings Calc.
    • Savings Goal Calc.
    • Financial Calculators
  • Inf. Adjusted Prices
    • Energy >
      • Inflation Adj. Gas Prices
      • Historical Oil Prices Chart
      • Crude Oil Price (Table)
      • Natural Gas Prices
      • Electricity Prices
      • Oil vs Gold
    • Gold >
      • Inflation Adjusted Annual Average Gold Prices
      • Gold is a “Crisis Hedge” not an  “Inflation Hedge”
      • Comparing Oil vs. Gold
    • Corn Prices
    • Education Inflation
    • Housing Prices
    • Mortgage Rates
    • NYSE Index
    • Inf. Indexed Bonds
    • Movie Revenues
    • Inflation-Adjusted Wages
  • Cost of Living
    • Calculate Cost of Living
    • Cost-of-living Adj. (COLA)
    • Consumer Price Index CPI
      • Historical CPI
      • Current CPI
      • CPI Release Dates
    • Gas Prices >
      • Cost of Gas
      • Cost of Gas Per Month
      • Gas vs. Oil Price Chart
    • Food Prices 1913 vs 2013
    • Health Insurance
  • Blog
    • Key Inflation Articles
    • International Inflation
    • Historical Inflation Rates for Japan (1971 to 2014)
You are here: Home » Blog » Inflation » July Inflation Numbers Minimal

July Inflation Numbers Minimal

Published on August 19, 2015 Updated on November 4, 2021 by Tim McMahon Leave a Comment

The Bureau of Labor Statistics (BLS) released their monthly Consumer Price Index (CPI-U) and Inflation report for the year ending in July on August 19th . Annual Inflation came in at 0.17%. That means that something that cost $100 a year ago would cost $100.17 today. That is compared to the typical inflation of around 3% which would mean that something that cost $100 last year would cost $103 this year.

The BLS rounds this to .2% which of course is so small that almost any one of the deflationary months last year would cancel out all the inflation we’ve seen over the previous 12 months. The CPI-U index a year ago was 238.250 and is currently 238.654.

We have seen significant deflationary pressures over the last year with the entire 4th quarter of 2014 was deflationary with October at -0.25% in one month, then November racked up a whopping -0.54%, and December tacked on another -0.57%. And to top it all off the normally highly inflationary January (2015) came in deflationary instead at -0.47%. So those four months alone resulted in -1.83% deflation. The months of February through May were highly inflationary and they just about cancelled out the previous deflation and then June’s 0.35% brought the annual inflation rate into positive territory at 0.12% Annual inflation. Monthly inflation for July was virtually zero 0.01% but because last July was slightly negative at -0.04% as that number fell out of the calculation annual inflation inched up very slightly.

Adding to the deflationary forces for 2014, July and August also saw monthly deflation as prices fell -0.04% and -0.17% respectively.

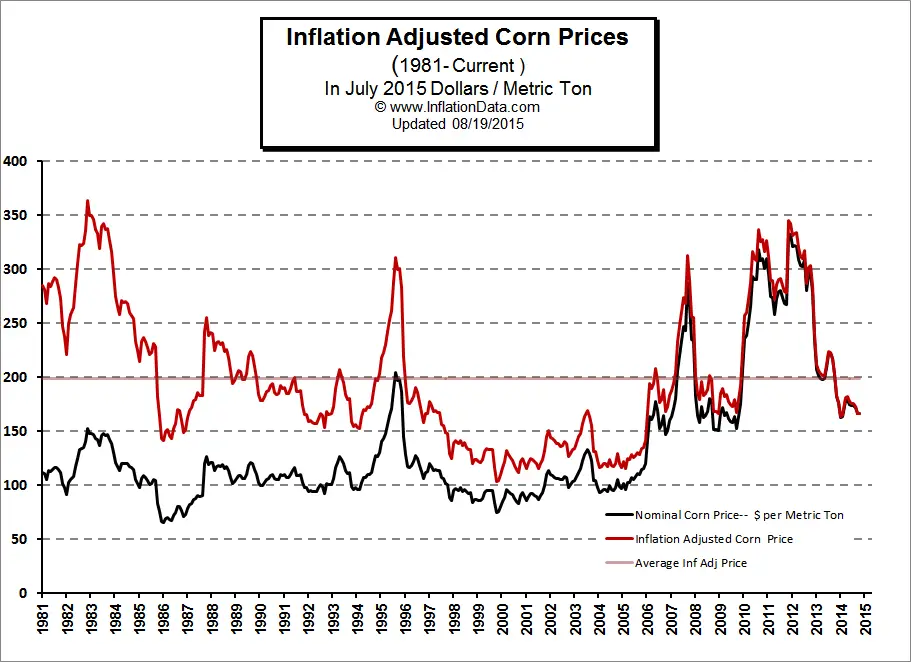
Has ethanol really driven up the price of Corn?

We’ve updated the Inflation Adjusted Corn Prices Chart so you can see how corn prices have changed over the years.
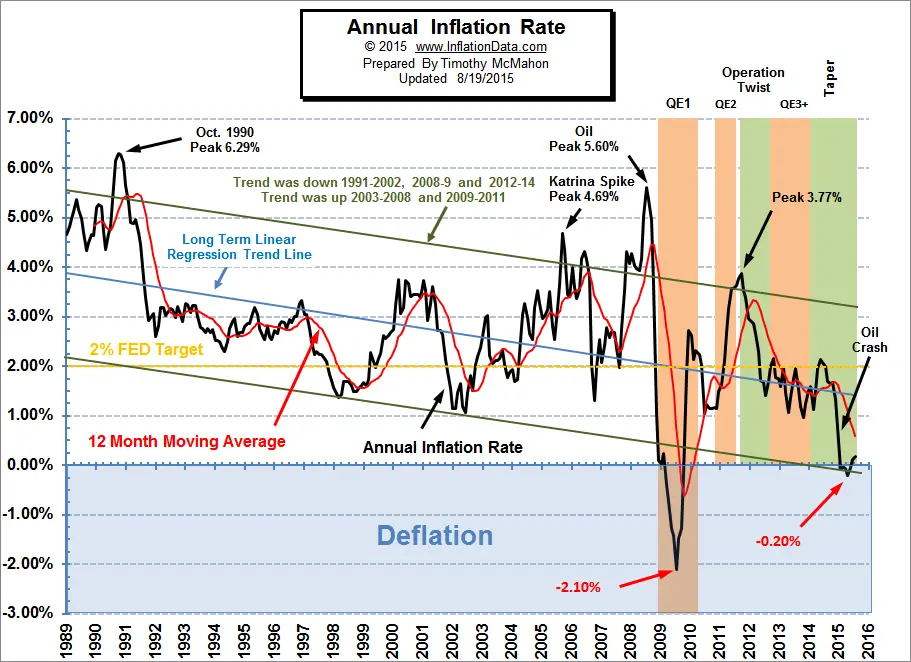
Inflation_Adjusted_Corn_Price

Annual Inflation

Our Annual Inflation Chart shows how small the current blip is with two months barely visible above the zero line. We can also see how small the deflation was with Annual inflation in the last four months going from  -0.20% to +0.17%.

Annual_Inflation_chart


Bear Markets And Economic Contractions: 2001/2008 vs. 2015

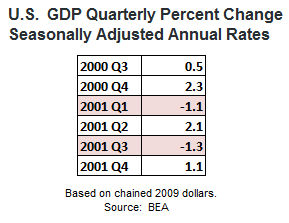
 Bear markets typically are caused by one of two things: a recession or tight monetary conditions. For example, the 2000-2002 bear market featured a rough economic period in 2001 (see table below).

This week’s video makes additional fact-based comparisons of the present day to both 2001 and 2008, allowing us to better understand correction odds relative to bear market odds.

 Read More…

NYSE ROC

The New York Rate of Change chart still has its sell signal.

NASDAQ ROC

NASDAQ  still has a SELL signal.

Inflation Projections

Our Moore Inflation projection (MIP) continues to perform well and is projecting a an increase in inflation into year end. Back in January it generated this chart based on December 2014 data:

MIP-Reality 8-19-15
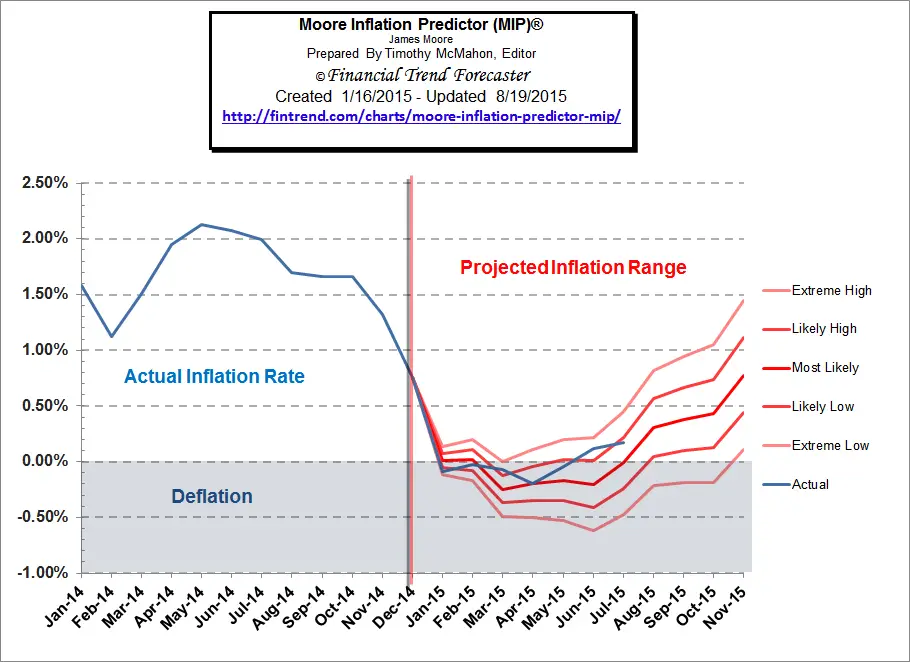
As we can see it has done a good job of tracking the most likely line for 7 months now.

Currently the Moore Inflation Predictor is projecting a rebound in inflation up to the 2% range near year end.

Moore_Inflation_Predictor_Aug_15

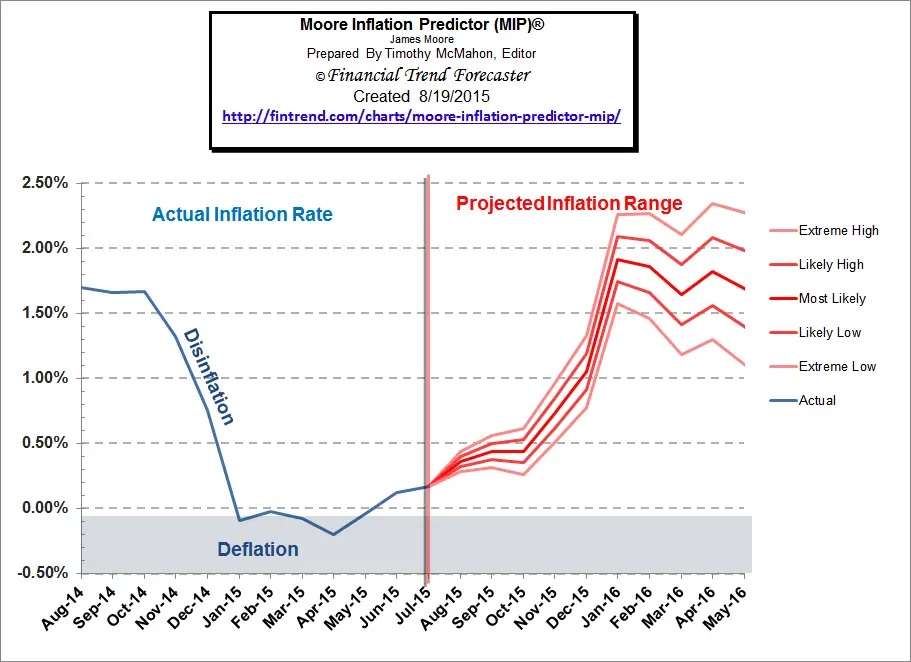
However, the new year should see some moderation in the inflation rate. For more information see Inflation Forecast.
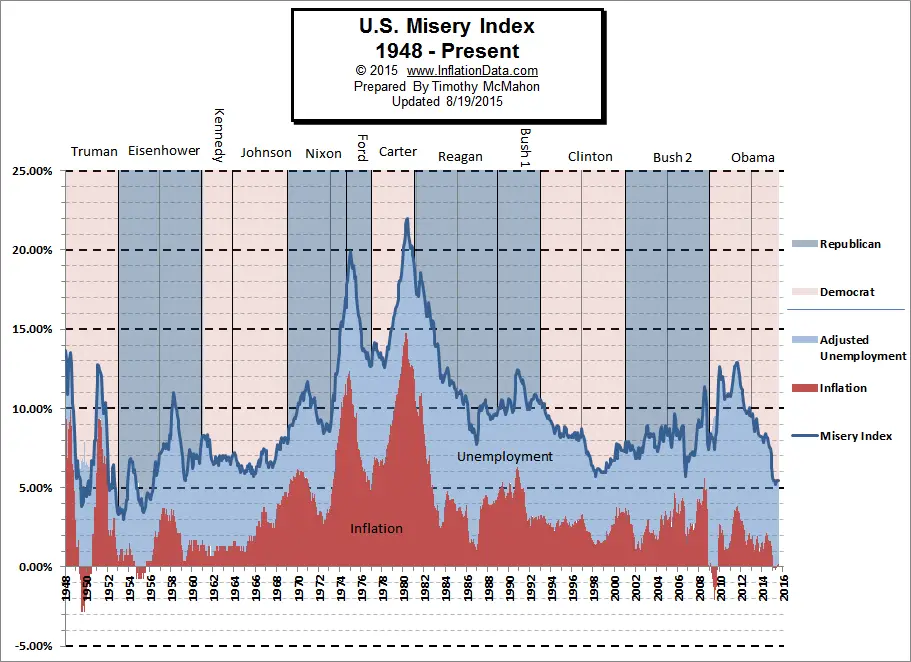
Misery Index

The misery index as of August 2015 (based on the most recent official government data for July 2015) is at 5.47% (5.3% unemployment and 0.17% inflation) down from a peak of 12.87% in both October and November 2011.

U.S. Misery Index August 2015

You might also like:

  • Bank Closures “Could Never Happen Here”
  • Comparing the Cost of Living When Retiring (or Moving)
  • World War D—Deflation
  • Wall Street Worries Just a Bit of Inflation Will Shock Markets

About Tim McMahon

  • Web
  • |
  • Twitter
  • |
  • Facebook
  • |
  • LinkedIn
  • |
  • More Posts(419)

Filed Under: Inflation Tagged With: August, inflation, July inflation, MIP, Misery, ROC

Leave a Reply Cancel reply

Your email address will not be published. Required fields are marked *

This site uses Akismet to reduce spam. Learn how your comment data is processed.

Recent Posts

  • May Inflation Up to 4.25%
  • May 2026: BLS April Inflation
  • How will FED Chairman Warsh affect Rates and Inflation?
  • Ben Cowan: Is the Fed Heading Toward Checkmate?
  • The Truth About Truflation vs. the BLS’s CPI

Subscribe Now

eTrends Signup Form

A Message from Our Editor

Eliminate Debt

Post Archives

Sponsored:

As a Seasoned Investor I thought I'd seen everything... But recently I discovered TradingView which has really improved the information I have at my fingertips.~ Tim McMahon, editor

TradingView gives me an edge... including powerful charting tools, real-time market data, and a global community of traders—all in one easy to use platform. It has hundreds of indicators, and even custom scripts for more advanced users, and you don't need to change Brokers just use its seamless brokerage integration... TradingView isn't just a charting tool—it's your full trading command center.

Trade smarter. Trade faster. Check Out TradingView for free.

----------

The Best Place to Buy Your Crypto

Coinbase is the largest Crypto Trading platform in the U.S. and the easiest to use. ~Tim McMahon, editor

Check out Coinbase here

Home | Articles | Sitemap | Terms of Service | Privacy | Disclaimer | Advertise With Us

Copyright © 1996-2026 · Capital Professional Services, LLC · Maintained by Design Synergy Studio · Admin

Do Not Sell My Personal Information