
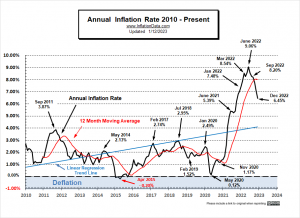
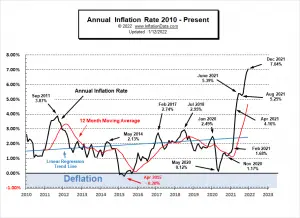
The Bureau of Labor Statistics reported that Annual Inflation fell from 7.11% in November to 6.45% in December 2022. This was down from a peak of 9.06% in June 2022. Monthly inflation was negative (Disinflation) for November at -0.10% and December at -0.31%. This is fairly typical for the fourth quarter, which is traditionally negative. Monthly inflation for 2022 was lower than in November 2021, so December Annual inflation fell. It is important to remember that although the inflation RATE is falling... prices are still going up, i.e., prices are still 6.5% higher than they were a year ago. A decline from 7.5% to 6.5% is similar to a car going from 75 mph to 65 mph... it is still … [Read more...]
Inflation Down in November
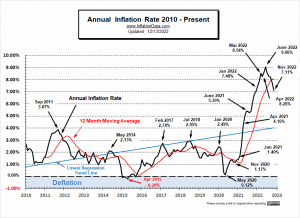
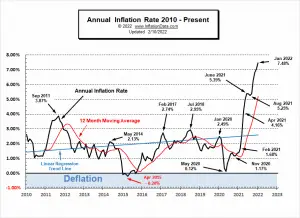
The Bureau of Labor Statistics reported that Annual Inflation fell from 7.75% in October to 7.11% in November 2022. This was down from a peak of 9.06% in June 2022. Monthly inflation was negative (Disinflation) for November at -0.10%. This is fairly typical for the fourth quarter, which is traditionally negative. Monthly inflation for 2022 was lower than in November 2021 so Annual inflation fell. It is important to remember that although the inflation RATE is falling... prices are still going up, i.e., prices are still 7% higher than they were a year ago. A decline from 7.75% to 7.11% is similar to a car going from 77 mph to 71 mph... it is still speeding forward just not quite as … [Read more...]
2022: Highest June Inflation Since 1941
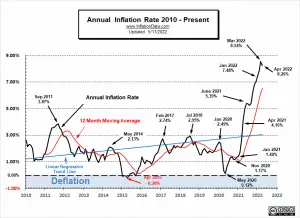
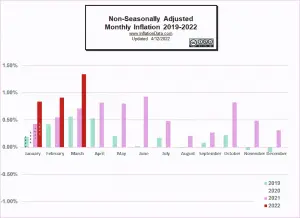
The Bureau of Labor Statistics reported that in June 2022, Annual Inflation rose to 9.1% Inflation Summary: Annual Inflation Rose from 8.58% in May to 9.06% in June CPI Index rose from 292.296 to 296.311 Monthly Inflation for June was 1.37%, the highest June since 1941 The next release is on August 10th June 2022, Annual Inflation was 9.06%. Jan. 2021 -- 1.40% ** Jan. 2022 -- 7.48% ** Feb. 2022 -- 7.87% ** March 8.54% Apr. 2022 --8.26% ** May 2022 -- 8.58% ** June 2022 -- 9.06% Crude Oil prices averaged over $100 per barrel for June. While according to the AAA, Regular Gasoline prices averaged $5.016 in mid-June. Monthly Inflation At 0.84% (January), 0.91% … [Read more...]
Inflation Takes a Bite Out of Your Food Budget

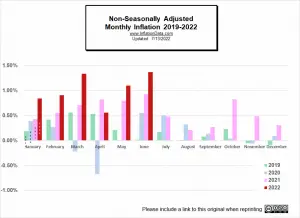
The Bureau of Labor Statistics reported that in May 2022, Annual Inflation Rose. May Food Inflation Breaks Record: The combined food index (at home and away) increased 10.1 percent for the 12-months ending May, the first annual increase of 10 percent or more since the period ending March 1981. Food at home rose even more... 11.9% over the last 12 months... while food away from home "only" rose 7.4% over the last year. All six major grocery store food group indexes rose in May. The index for dairy and related products rose 2.9 percent, its largest monthly increase since July 2007. The index for nonalcoholic beverages increased 1.7 percent, and the index for other food at home rose … [Read more...]
April Inflation Down, But…
The Bureau of Labor Statistics reported that in April 2022, Inflation fell to 8.3% Inflation Summary: Annual Inflation Declined from 8.54% in March to 8.26% in April CPI Index rose from 287.504 to 289.109 Monthly Inflation for April was 0.56%, down from 1.34% in March The next release is on June 10th April 2022 Annual Inflation was 8.26%. Jan. 2021 -- 1.40% ** Jan. 2022 -- 7.48% ** Feb. 2022 -- 7.87% ** March 8.54% Gasoline prices were artificially lower due to a massive release from the Strategic Petroleum Reserves (SPR), which temporarily pushed inflation down in April. The International Energy Agency was not happy that the Biden administration didn't warn them that it … [Read more...]
March Inflation Highest Since 1981
The Bureau of Labor Statistics reported that in March 2022 Inflation Hit 8.5% Inflation Summary: Annual Inflation is the highest since December 1981. CPI Index rose from 283.716 to 287.504. Monthly Inflation for March was 1.34% up from February's 0.91% The next release is on May 11th March 2022 Annual Inflation was 8.54%. Jan. 2021 -- 1.40% ** Jan. 2022 -- 7.48% ** Feb. 2022 -- 7.87% Higher Gasoline prices pushed inflation to new heights in March 2022. The last time inflation was higher was in December 1981 when it was 8.92% but then it was declining from the March 1980 peak of 14.76%. Although we calculate it to two decimal places the Bureau of Labor Statistics … [Read more...]
January Inflation Nears 40 Year High
The Bureau of Labor Statistics reported Another Record High Annual Inflation Rate in January. Inflation Summary: Annual Inflation highest since February 1982. CPI Index rose from 278.802 to 281.148. Monthly Inflation for January was 0.84% The next release is on March 10th Annual Inflation for the 12 months ending in January was 7.48%. Jan. 2021- 1.40% -- Jan 2022- 7.48% 2021 Inflation Rates Feb 2021 1.68% -- June 2021 5.39% -- Dec. 7.04% Inflation soared from January 2021 to January 2022 reaching an almost 40 year high. The last time inflation was higher was in February 1982 when it was 7.62% but then it was declining from the March 1980 peak of 14.76%. As you … [Read more...]
December 2021 Inflation 5 Times as High as Last December
The Bureau of Labor Statistics reported Record High Annual Inflation Rate in December. Inflation Summary: Annual Inflation highest since June 1982. CPI Index rose from 277.948 to 278.802. Monthly Inflation for December was 0.31% The next release is on February 10th Annual Inflation for the 12 months ending in December was 7.04%. 2021 Inflation Rates Nov. 6.81% -- Oct. 6.22% -- Sept. 5.39% -- Aug. 5.25% -- July 5.37% -- June 5.39% -- January 1.40% Inflation in December 2020 was just 1.36%, but by December 2021, Inflation had multiplied over five times in a single year to 7.04%. As you can see from the chart below, current levels have exceeded the July 2008 peak of … [Read more...]
Millennials Have Never Seen Inflation This High

The Bureau of Labor Statistics reported that the Annual Inflation Rate rose again in November. Inflation Summary: Annual Inflation highest since May 1982. CPI Index rose from 276.589 to 277.948. Monthly Inflation for November was 0.49% Next release January 12, 2022 Inflation for the 12 months ending in November was Up again from October. October 6.22% -- November 6.81% The earliest millennials were born somewhere between 1980-1985 (depending on which definition of millennial you use), just as we were coming off one of the highest Inflation spikes the U.S. has seen since they began tracking the CPI in 1913. In March of 1980, Inflation topped at 14.76%. By May of 1982, … [Read more...]
September Inflation Rebounds
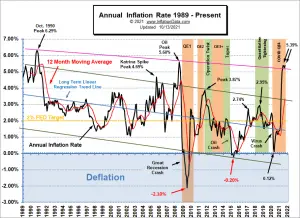
The Annual Inflation Rate rebounded in September, according to the Bureau of Labor Statistics report. Inflation Summary: Annual inflation was 5.39% in September, 5.25% in August, 5.37% in July, and 5.39% in June. CPI Index rose from 273.567 in August to 274.310 in September. Monthly Inflation for September was 0.27%, August was 0.21%, and July was 0.48%. Next release November 10th Inflation for the 12 months ending in September was Up from August. Since the BLS rounds to 1 decimal place, they reported June and July as 5.4% and August as 5.3%. So September is once again at June levels. The last time inflation was this high was the 5.60% of July 2008. Before that, we … [Read more...]
