
The Bureau of Labor Statistics reported that the Annual Inflation Rate rose again in November. Inflation Summary: Annual Inflation highest since May 1982. CPI Index rose from 276.589 to 277.948. Monthly Inflation for November was 0.49% Next release January 12, 2022 Inflation for the 12 months ending in November was Up again from October. October 6.22% -- November 6.81% The earliest millennials were born somewhere between 1980-1985 (depending on which definition of millennial you use), just as we were coming off one of the highest Inflation spikes the U.S. has seen since they began tracking the CPI in 1913. In March of 1980, Inflation topped at 14.76%. By May of 1982, … [Read more...]
September Inflation Rebounds
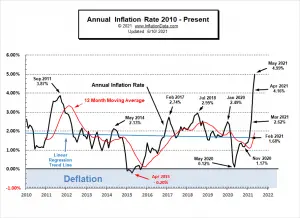
The Annual Inflation Rate rebounded in September, according to the Bureau of Labor Statistics report. Inflation Summary: Annual inflation was 5.39% in September, 5.25% in August, 5.37% in July, and 5.39% in June. CPI Index rose from 273.567 in August to 274.310 in September. Monthly Inflation for September was 0.27%, August was 0.21%, and July was 0.48%. Next release November 10th Inflation for the 12 months ending in September was Up from August. Since the BLS rounds to 1 decimal place, they reported June and July as 5.4% and August as 5.3%. So September is once again at June levels. The last time inflation was this high was the 5.60% of July 2008. Before that, we … [Read more...]
August 2021 Inflation Down Slightly
On September 14th, 2021, the Bureau of Labor Statistics said that in August 2021, the Annual Inflation Rate was down. Inflation Summary: Annual Inflation was 5.25% in August, 5.37% in July, and 5.39% in June. CPI Index rose from 273.003 in July to 273.567 in August. Monthly Inflation for July was 0.48% and 0.21% for August. Next release October 13th Inflation for the 12 months ending in August was down 0.12% from July. Since the BLS rounds to 1 decimal place, they reported June and July as 5.4% and August as 5.3%. The last time inflation was this high was the 5.6% of July 2008. Prior to that, we have to go all the way back to the 6.29% of October 1990 to find a higher … [Read more...]
BLS says July Inflation Holds Steady at 5.4%
The U.S. Bureau of Labor Statistics released their Consumer Price Index News Release for the month of July on August 11th, 2021. Inflation Summary: Annual Inflation 5.37% virtually identical to June's 5.39% CPI Index rose from 271.696 in June to 273.003 in July. Monthly Inflation for June was 0.93% and July was 0.48%. Next release September 14th Inflation for the 12 months ending in July was 5.37% identical to August 2008, July 2008 was the previous Peak at 5.60% Last month's 5.39% was the largest increase since August 2008's 5.37%. (Since the BLS rounds to 1 decimal place they reported last month, this month, and August 2008 as 5.4%). If inflation tops the 5.6% of July … [Read more...]
June 2021: Highest Annual Inflation since 2008
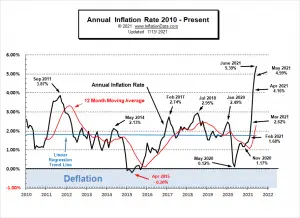
Inflation Summary: Annual Inflation up sharply to 5.39% CPI Index rose from 269.195 in May to 271.696 in June. Monthly Inflation for March 0.71%, April 0.82%, May 0.80%, and June was 0.93% . Next release August 11th Inflation for the 12 months ending in June was 5.39% for the Largest Annual Increase since July 2008's 5.60% Last month's 4.99% was the largest increase since August 2008's 5.37% but at 5.39% June 2021 was actually slightly higher than that. (Although the BLS reported them both as 5.4%). If inflation tops the 5.6% of July 2008, we have to go all the way back to the 6.29% of October 1990 to find a higher peak. We have been predicting Annual Inflation would … [Read more...]
May’s Annual Inflation Soars to ~5%
Inflation Summary: Annual Inflation up sharply to ~5% (actually 4.99%) CPI Index rose from 267.054 in April to 269.195 in May. Monthly Inflation for April was 0.82% and 0.80% in May. We have to go back to the Oil Peak of 2008 to see higher inflation. Next release July 13th Annual inflation for the 12 months ending in May was 4.99% Since February, we have been predicting Annual Inflation would shoot up in March and April due to negative numbers falling out of the annual calculation. Although May 2020 was not negative it was virtually zero so replacing it with a massive 0.80% monthly inflation caused the Annual inflation rate to soar once more. Since the BLS rounds … [Read more...]
April Inflation More than Double FED Target
Inflation Summary: Annual Inflation up sharply from 2.62% in March to 4.16% in April. CPI Index rose massively from 264.877 in March to 267.054 in April. Monthly Inflation for March was 0.71% and for April was 0.82%. We have to go back to the Oil Peak of 2008 to see higher inflation. Next release June 10th Annual inflation for the 12 months ending in April was 4.16% We have been predicting Annual Inflation would shoot up in March and April due to negative numbers falling out of the annual calculation. Since the BLS rounds their numbers to 1 decimal place they reported March as 2.6% and April as 4.2% taking inflation well above the FED's 2% target rate. Due to … [Read more...]
March Inflation Skyrockets
Inflation Summary: Annual Inflation up from 1.68% in February to 2.62% in March. CPI Index rose slightly from 263.014 in February to 264.877 in March. Monthly Inflation for February was 0.55% and March was 0.71%. Next release May 12th Annual inflation for the 12 months ending in March was 2.62% We have been predicting Annual Inflation would shoot up in March due to higher gas prices and negative numbers falling out of the annual calculation. Further increases to come in April and May. Since the BLS rounds their numbers to 1 decimal place they reported February as 1.7% and March as 2.6% for a monthly increase of 9/10ths of 1% taking inflation well above the FED's 2% … [Read more...]
January Inflation Setting Stage for Big Run Up
Inflation Summary: Annual Inflation up from 1.36% in December to 1.40% in January. CPI Index rose slightly from 260.474 in December to 261.582 in January. Monthly Inflation for December was 0.09%, January was 0.43%. Next release March 10th Annual inflation for the 12 months ending in January was 1.40% The CPI index itself was up from 260.474 in December to 261.582 in January. Resulting in a monthly inflation rate of 0.43%. Annual inflation for the 12 months ending in December was 1.36%, the 12 months ending in January was 1.40%. Since the BLS rounds their numbers they report both as 1.4%. Setting the Stage for Inflation Due to the Corona Virus, March and April … [Read more...]
December Inflation Up Slightly
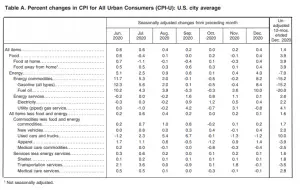
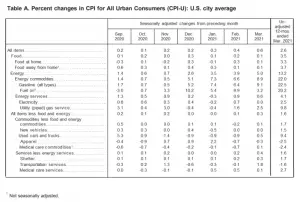
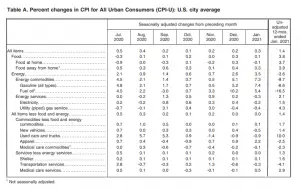
Inflation Summary: Annual Inflation up from 1.17% in November to 1.36% in December. CPI Index rose slightly from 260.229 in November to 260.474 in December. Monthly Inflation for December was 0.09%, November was -0.06%. Next release February 10th BLS Commissioner's Inflation Report: According to the BLS commissioner's report, "The Consumer Price Index for All Urban Consumers (CPI-U) increased 0.4 percent in December on a seasonally adjusted basis after rising 0.2 percent in November, the U.S. Bureau of Labor Statistics reported today. Over the last 12 months, the all items index increased 1.4 percent before seasonal adjustment. The seasonally adjusted increase in the all … [Read more...]
