
The Bureau of Labor Statistics reported that in April 2022, Inflation fell to 8.3%
Inflation Summary:
- Annual Inflation Declined from 8.54% in March to 8.26% in April
- CPI Index rose from 287.504 to 289.109
- Monthly Inflation for April was 0.56%, down from 1.34% in March
- The next release is on June 10th
April 2022 Annual Inflation was 8.26%.
Jan. 2021 — 1.40% ** Jan. 2022 — 7.48% ** Feb. 2022 — 7.87% ** March 8.54%
Gasoline prices were artificially lower due to a massive release from the Strategic Petroleum Reserves (SPR), which temporarily pushed inflation down in April. The International Energy Agency was not happy that the Biden administration didn’t warn them that it would release 180 million barrels of oil from reserves since this is typically a coordinated international effort. So the agency was caught off guard and had to play catch up.
According to the AAA, Gasoline prices averaged $4.098 a month ago but are already back up to record highs this month, and Biden is talking about replenishing the SPR.
BLS April 2022 Inflation Report:
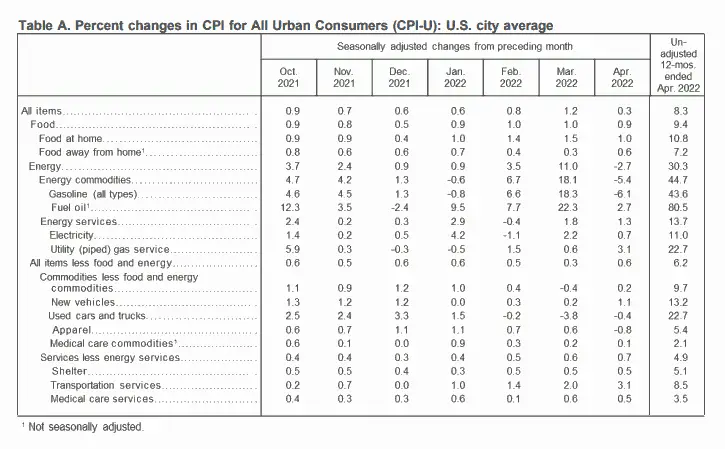
According to the BLS commissioner’s report, ‘The Consumer Price Index for All Urban Consumers (CPI-U) increased 0.3 percent in April on a seasonally adjusted basis after rising 1.2 percent in March, the U.S. Bureau of Labor Statistics reported today.
Over the last 12 months, the all items index increased 8.3 percent before seasonal adjustment. Increases in the indexes for shelter, food, airline fares, and new vehicles were the largest contributors to the seasonally adjusted all items increase.
The food index rose 0.9 percent over the month, as the food at home index rose 1.0 percent. The energy index declined in April after rising in recent months. The index for gasoline fell 6.1 percent over the month, offsetting increases in the indexes for natural gas and electricity.
The index for all items less food and energy rose 0.6 percent in April, following a 0.3-percent advance in March. Along with indexes for shelter, airline fares, and new vehicles, the indexes for medical care, recreation, and household furnishings and operations all increased in April. The indexes for apparel, communication, and used cars and trucks all declined over the month.”
 The good news was that Gasoline and New and Used Vehicles were down. The bad news was that pretty much everything else was up.
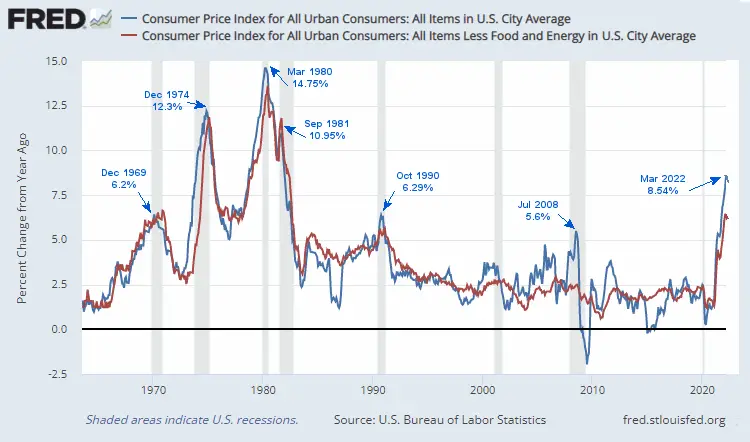
Inflation All Items vs. Core Inflation Chart
At its March meeting, the Fed signaled that it would be reducing its massive bond holdings at a maximum pace of $95 billion a month to cool inflation. This is set to begin in May. But FED Assets have already started leveling off.
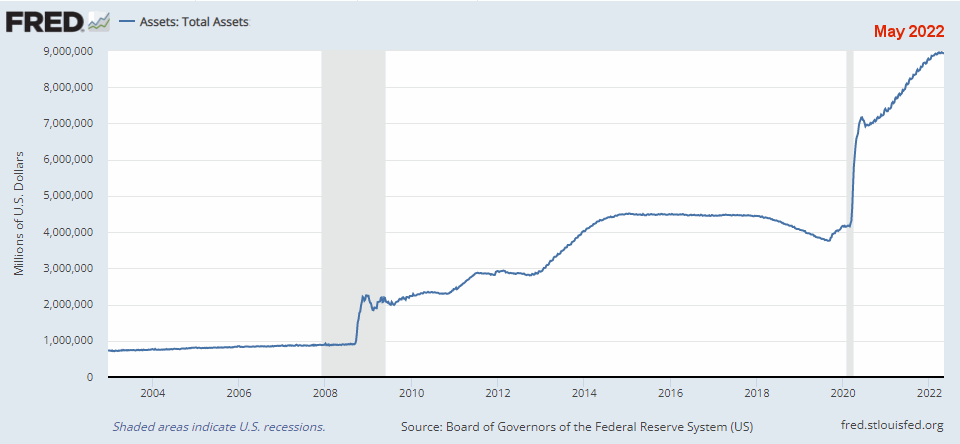
We say “already,” but many former FED officials say it should have started last September. The criticism from former colleagues is the sharpest and most widespread since the 1970s.
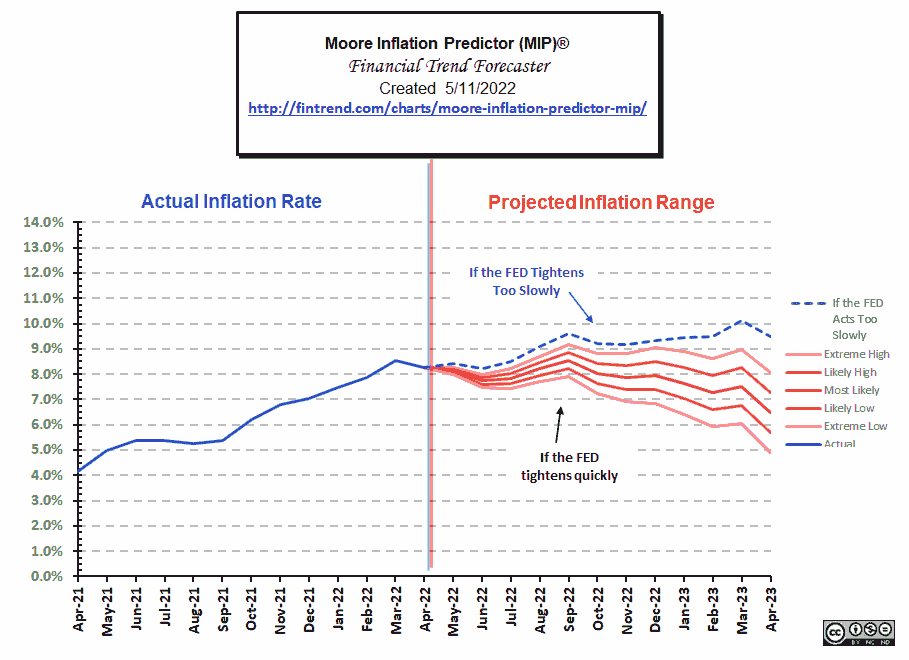
Moore Inflation Predictor
At first glance, the Moore Inflation Predictor chart doesn’t look too bad. After all, it is declining. But when you look closer, you realize that a year from now, the best we can hope for is 5% inflation, and 9% isn’t out of the realm of possibility.
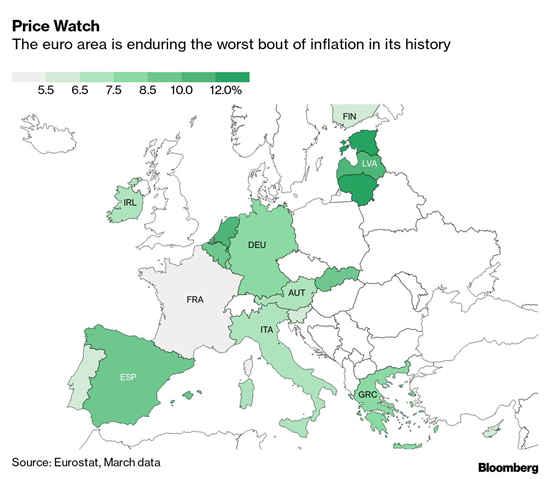
 It isn’t just our Central Bank that has been printing money for too long European Central Banks have followed our lead and are now in the same situation as we are.
Monthly Inflation
At 0.84% (January), 0.91% (February), and 1.34% (March), monthly inflation was high even for the first quarter of the year when monthly inflation is already at its highest. April is the first month this year to come in lower than 2021.
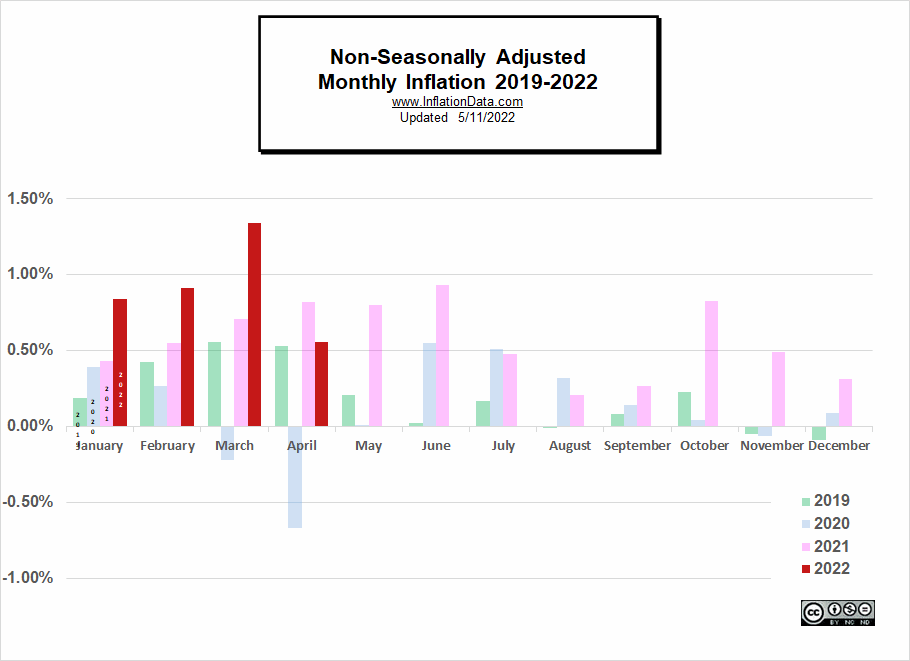
Not Seasonally Adjusted Monthly Inflation Rates
Note: January 2022’s 0.84% was the highest January since 1990.
| Jan | Feb | Mar | Apr | May | Jun | Jul | Aug | Sep | Oct | Nov | Dec | |
| 2016 | 0.17% | 0.08% | 0.43% | 0.47% | 0.41% | 0.33% | (0.16%) | 0.09% | 0.24% | 0.12% | (0.16%) | 0.03% |
| 2017 | 0.58% | 0.31% | 0.08% | 0.30% | 0.09% | 0.09% | (0.07%) | 0.30% | 0.53% | (0.06%) | 0.002% | (0.06%) |
| 2018 | 0.54% | 0.45% | 0.23% | 0.40% | 0.42% | 0.16% | 0.01% | 0.06% | 0.12% | 0.18% | (0.33%) | (0.32%) |
| 2019 | 0.19% | 0.42% | 0.56% | 0.53% | 0.21% | 0.02% | 0.17% | (0.01%) | 0.08% | 0.23% | (0.05%) | (0.09%) |
| 2020 | 0.39% | 0.27% | (0.22%) | (0.67%) | 0.002% | 0.55% | 0.51% | 0.32% | 0.14% | 0.04% | (0.06%) | 0.09% |
| 2021 | 0.43% | 0.55% | 0.71% | 0.82% | 0.80% | 0.93% | 0.48% | 0.21% | 0.27% | 0.83% | 0.49% | 0.31% |
| 2022 | 0.84% | 0.91% | 1.34% | 0.56% |
See: Monthly Inflation Rate for more information and a complete table of Unadjusted Monthly Rates.
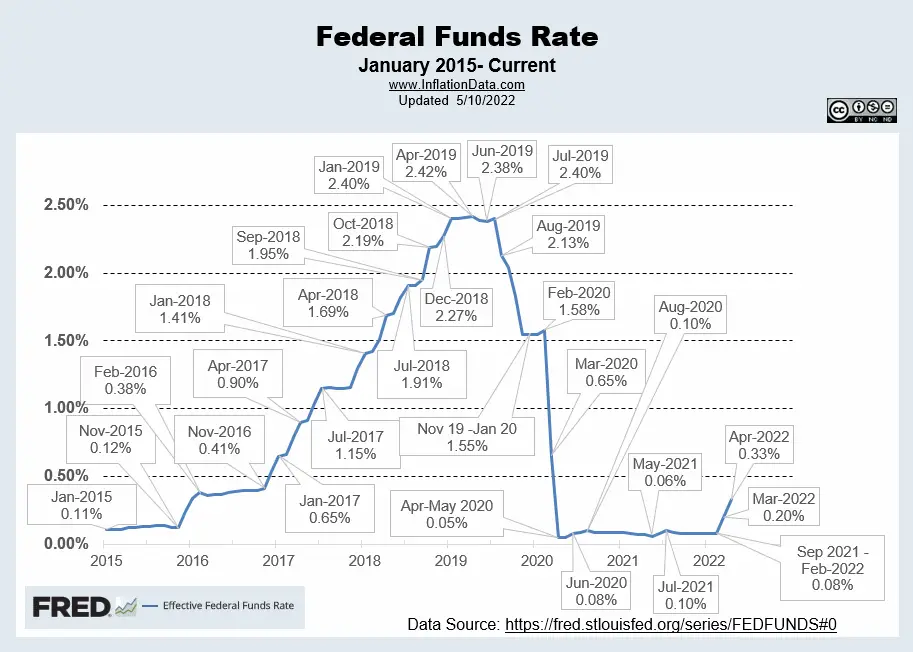
FED Funds Rate
In April 2022, the FED raised interest rates to 0.33%.
 Although the FED’s announcement sounds aggressive, many commentators don’t believe it is enough to fight inflation. Jeffrey Tucker says, “The Fed’s theory is that it can put out the house fire by carefully spraying a bit of water here and there in a way that doesn’t cause shock and alarm.”
Others are saying to be economically viable short-term interest rates need to be higher than the inflation rate, i.e., investors need to earn a “real rate of return”.
As recently as 2019, rates were 7 times higher than the April 2022 rate at 2.42%. In 2007 they were over 5%, and the last time inflation was this high, rates were at 14.94% to combat inflation.
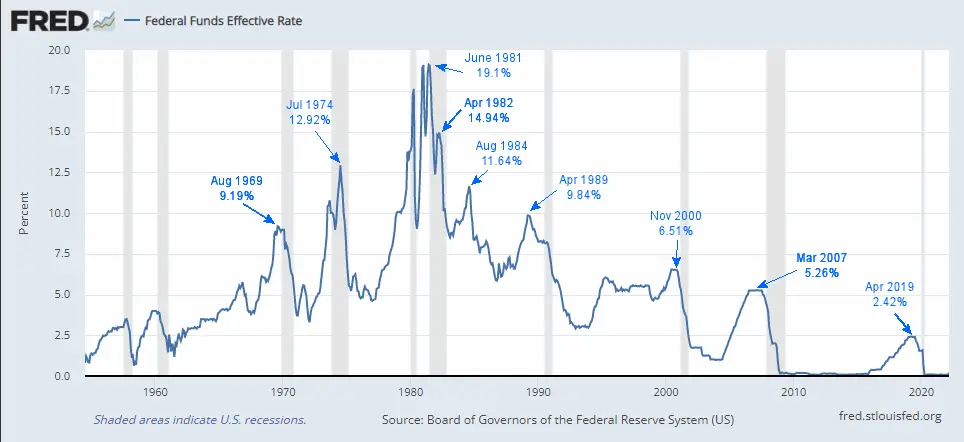
Chart Data Source St Louis FED.
For more info, See NYSE ROC and MIP.
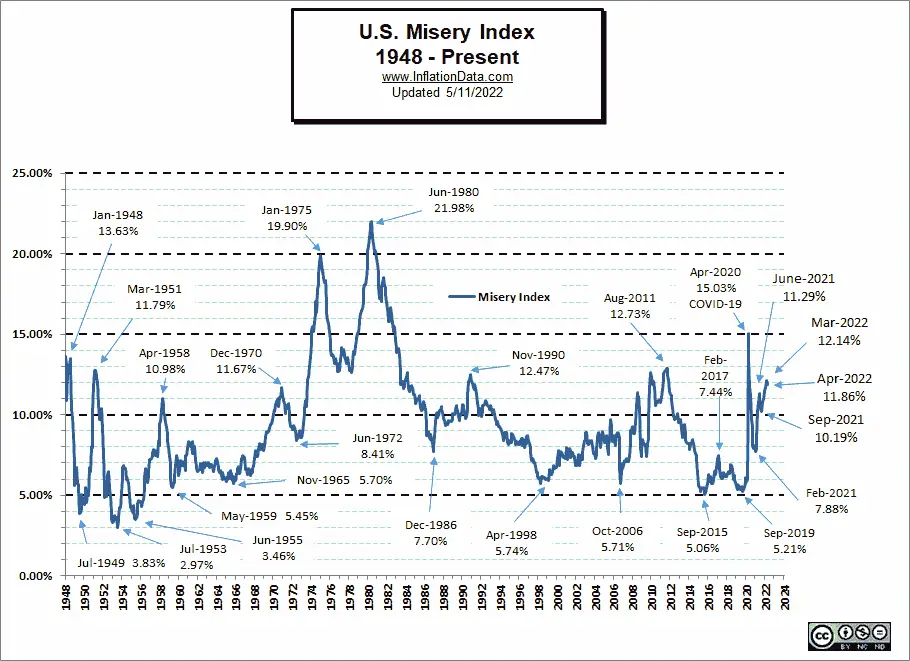
Misery Index
Unemployment was unchanged in April, and Inflation was down slightly, so the Misery index decreased.
| Unemployment | Inflation | Misery Index | |
| January 2022 | 4.0% | 7.48% | 11.48% |
| February 2022 | 3.8% | 7.87% | 11.67% |
| March 2022 | 3.6% | 8.54% | 12.14% |
| April 2022 | 3.6% | 8.26% | 11.86% |
[Read More…]
NYSE Rate of Change (ROC)©

Sell Signal
The NYSE ROC index is WAY below its moving average.
See the NYSE ROC for more info.
NASDAQ Rate of Change (ROC)©

Sell Signal
The NASDAQ ROC is well below its moving average.
See NASDAQ ROC for more.
You Might Also Like:
From InflationData.com
- Roots of Our Current Inflation
- How Families Are Adjusting To The Crazy Inflation Rates
- How To Invest In Cryptocurrency: 4 Tips For Beginners To Get Started
- March Inflation Highest Since 1981
- Does the CPI Exclude Mortgages or Rent?
- The History of Inflation in the United States
- How Inflation Helps Some and Hurts Others
- Don’t Blame Putin for High U.S. Inflation… Yet
From UnemploymentData.com.
- April Unemployment Holds Steady
- Jobs of the Future: Growing Your Career in the IT Field
- Practical Resources for Migrant Workers in the U.S.
- Is Intermodal Trucking The Right Job For You?
- What Is Hot Shot Trucking?
From Financial Trend Forecaster
- NYSE ROC Chart
- NASDAQ ROC Chart
- The Fed’s New “Tightening” Plan Is Too Little, Too Late
- Keynesians and Market Monetarists Didn’t See Inflation Coming
- Elon Musk Ambushes Twitter
- Can Ruthless Governments Make Crypto Worthless?
- Will Russian Sanctions Open a Can of Worms?
- In What Universe is $100+ Crude Oil Cheap?
- Economic Warfare Deployed Against Russia
- The Surprising Implications Of Declining Global Birth Rates
- Technology And The Semiconductor Chip Shortage
From Elliott Wave University
- Predicting the Collapse of a “Parabolic Rise”
- Surging Housing Prices Are Entering The Stratosphere- Look Out Below
- Germany’s DAX: What You Can Learn from the 2007 Top
- The Market is Currently a “Mixed Bag”
- The Journey to High-Confidence Trading Starts Now!
- Historically Investors Become “Long-term Buyers” at Precisely the Wrong Time
- Why the “60 / 40 Balance” May Be Hazardous to Your Portfolio
From OptioMoney.com
- Surprising Ways a Storage Unit Can Save You Money
- Guide to Managing Small Business Finances
- Unlock The Benefits Of A Good Credit Score
- Buying A Home When You Are Already In Debt
- Top 10 Tasks Businesses Should Outsource in 2022
- 7 Unexpected Costs Of Moving To A New Home
From Your Family Finances
- Approved Methods to Prepare Your Finances To Buy a Home
- 7 Ways to Lower Your Household Bills
- 4 Tips You Need To Know Before Buying Your First Home
- What You Need To Know About Water Damage Before Buying A Home
- How to Teach Your Teen to Budget Like a Pro
- How to Get the Best Deal on Car Insurance
- How to Prepare for a Monthly Mortgage Payment With Kids
- Everything you need to know about buying a car

Leave a Reply