
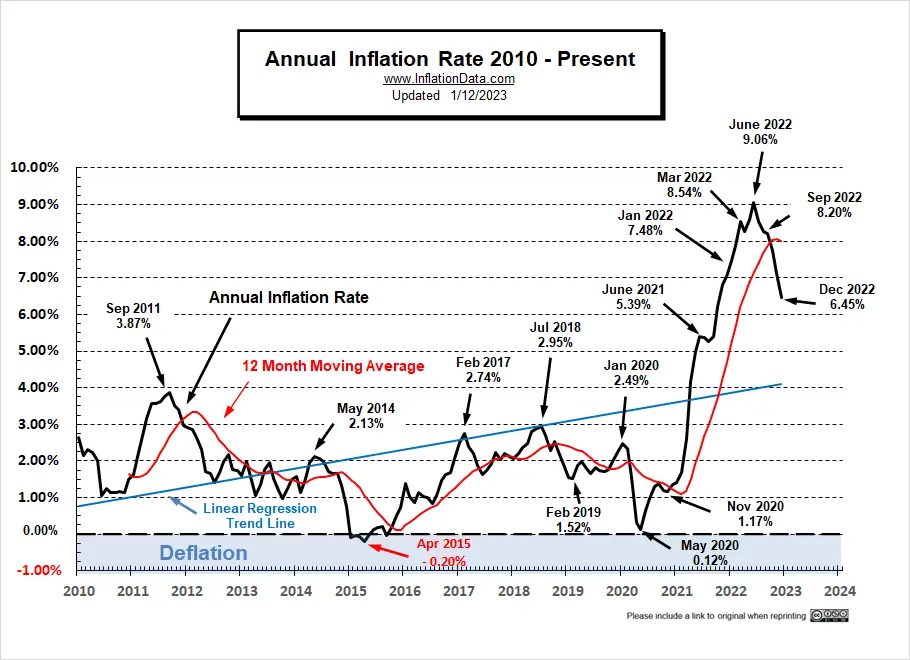
The Bureau of Labor Statistics reported that Annual Inflation fell from 7.11% in November to 6.45% in December 2022. This was down from a peak of 9.06% in June 2022.
Monthly inflation was negative (Disinflation) for November at -0.10% and December at -0.31%.
This is fairly typical for the fourth quarter, which is traditionally negative.
Monthly inflation for 2022 was lower than in November 2021, so December Annual inflation fell.
It is important to remember that although the inflation RATE is falling… prices are still going up, i.e., prices are still 6.5% higher than they were a year ago. A decline from 7.5% to 6.5% is similar to a car going from 75 mph to 65 mph… it is still speeding forward just not quite as quickly. Although the car is slowing.
December Inflation Summary:
- December Annual Inflation fell from 7.11% to 6.45%
- CPI Index fell from 297.711 to 296.797 (Disinflation)
- Monthly Inflation for December was -0.31%
- Next release February 14th 2023.
Jan. 2021 — 1.40% | Jan. 2022 — 7.48% | Jun. 2022 — 9.06% | Nov. 2022 — 7.11% | Dec. 2022 — 6.45%
The stock market saw this as an encouraging event. It is important to remember that although the inflation RATE is falling… prices are still going up, i.e., prices are still 6+% higher than they were a year ago. A decline from 7.11% to 6.5% is similar to a car going from 71 mph to 65 mph… it is still speeding forward, just not quite as quickly. Although the car is slowing.
BLS December Inflation Components:
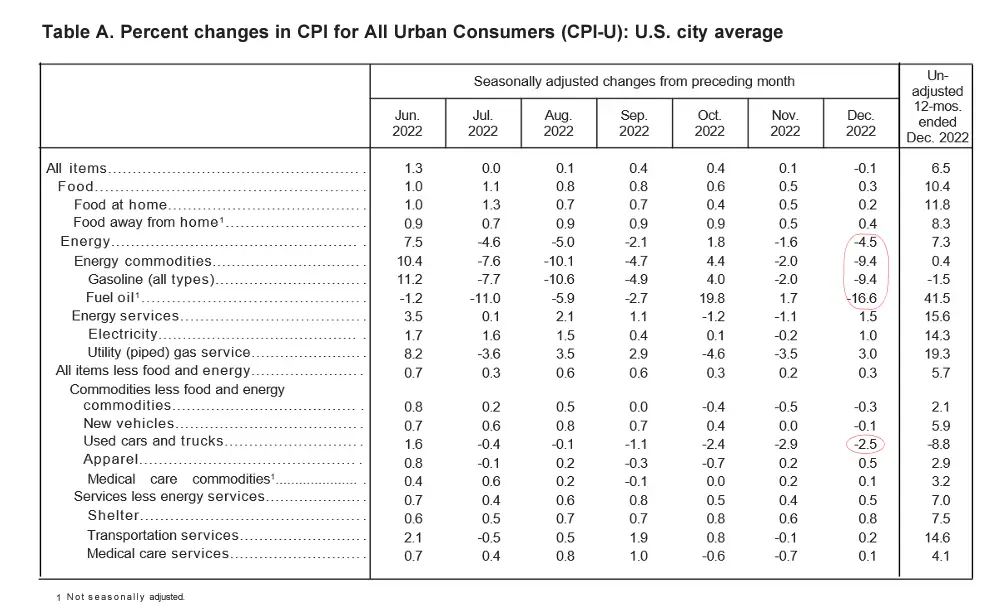 Basically, it was Gasoline and Oil that brought inflation down. since when they were excluded, almost all of the other prices actually went up. Looking at the seasonally adjusted monthly changes in the table above, we can see that Food Increased by 3/10ths of one percent while energy fell -4.5%. with fuel oil down a whopping -16.6%. Even energy “Services” (i.e. utilities) were up, but energy commodities were down sharply. Used vehicles were one of the few other decliners.
Since Food and Energy are the least correlated to FED policy, we can infer that December’s decline is no reason to assume that FED tightening is the reason for this decline in inflation. But of course, they will be happy to take credit for it. Other commodities fell slightly, but Services and Housing (shelter) rose more.
BLS Commentary:
The BLS Commissioner reported, “The Consumer Price Index for All Urban Consumers (CPI-U) declined 0.1 percent in December on a seasonally adjusted basis, after increasing 0.1 percent in November, the U.S. Bureau of Labor Statistics reported today. Over the last 12 months, the all-items index increased 6.5 percent before seasonal adjustment. The index for gasoline was by far the largest contributor to the monthly all-items decrease, more than offsetting increases in shelter indexes. The food index increased 0.3 percent over the month, with the food at home index rising 0.2 percent. The energy index decreased 4.5 percent over the month as the gasoline index declined; other major energy component indexes increased over the month. The index for all items less food and energy rose 0.3 percent in December, after rising 0.2 percent in November.”
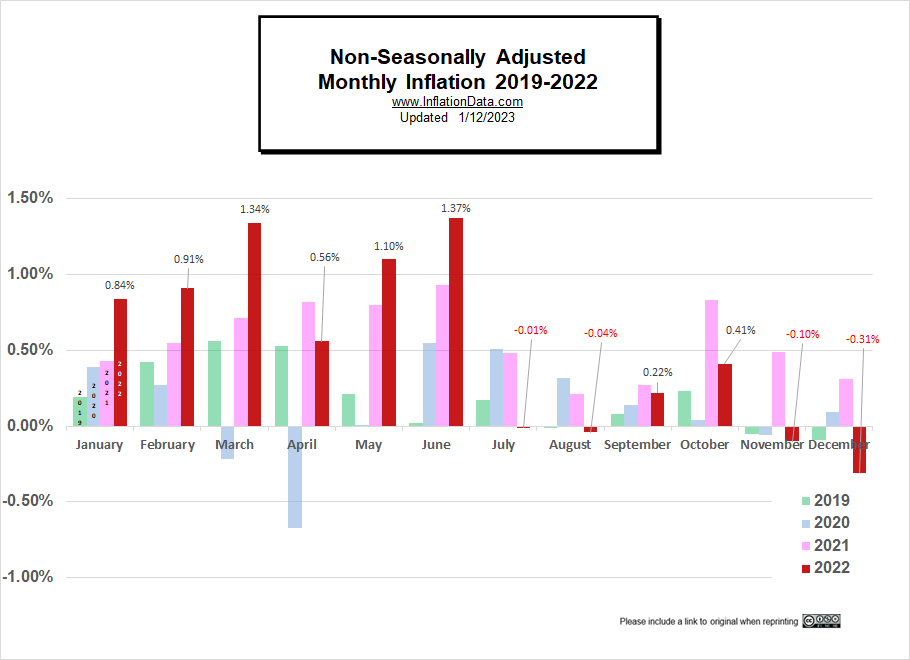
Monthly Inflation Compared to Previous Years:
In the following chart you can see how monthly inflation for 2022 (red bars) and 2021(pink bars) compares with 2020 (medium blue bars) and 2019 (light green bars). We can see that January’s massive red line was double even 2021’s pink line and February’s red line was well above 2021’s pink line.
Monthly inflation is often zero or negative in the 4th Quarter, but 2021’s entire 4th quarter was much higher than average. October’s monthly inflation was a massive 0.83%, compared to 0.04% in October 2020. November 2021 was 0.49% compared to -0.06% in 2020. This means that since the 4th quarter of 2022 was pretty typical (including negative numbers) we say a fairly significant drop in annual inflation.
Not Seasonally Adjusted Monthly Inflation Rates
Note: January 2022’s 0.84% was the highest January since 1990. June was the highest June since 1941 (although the first quarter of 1980 had some higher rates). Typically, June is the beginning of lower monthly rates.
| Jan | Feb | Mar | Apr | May | Jun | Jul | Aug | Sep | Oct | Nov | Dec | |
| 2016 | 0.17% | 0.08% | 0.43% | 0.47% | 0.41% | 0.33% | (0.16%) | 0.09% | 0.24% | 0.12% | (0.16%) | 0.03% |
| 2017 | 0.58% | 0.31% | 0.08% | 0.30% | 0.09% | 0.09% | (0.07%) | 0.30% | 0.53% | (0.06%) | 0.002% | (0.06%) |
| 2018 | 0.54% | 0.45% | 0.23% | 0.40% | 0.42% | 0.16% | 0.01% | 0.06% | 0.12% | 0.18% | (0.33%) | (0.32%) |
| 2019 | 0.19% | 0.42% | 0.56% | 0.53% | 0.21% | 0.02% | 0.17% | (0.01%) | 0.08% | 0.23% | (0.05%) | (0.09%) |
| 2020 | 0.39% | 0.27% | (0.22%) | (0.67%) | 0.002% | 0.55% | 0.51% | 0.32% | 0.14% | 0.04% | (0.06%) | 0.09% |
| 2021 | 0.43% | 0.55% | 0.71% | 0.82% | 0.80% | 0.93% | 0.48% | 0.21% | 0.27% | 0.83% | 0.49% | 0.31% |
| 2022 | 0.84% | 0.91% | 1.34% | 0.56% | 1.10% | 1.37% | (0.01%) | (0.04%) | 0.22% | 0.41% | (0.10%) | (0.34%) |
See: Monthly Inflation Rate for more information and a complete table of Unadjusted Monthly Rates.
Inflation Forecast
Looking back at the chart we created last February (almost a year ago), although there was a wide range of possibilities at that point, the actual line has come surprisingly close to our “most likely” projection, and I wouldn’t be surprised if next month the blue reality line crosses below the “most likely” line towards the “blue question mark”… meaning that as of this writing, this chart is spot on (blue dot).
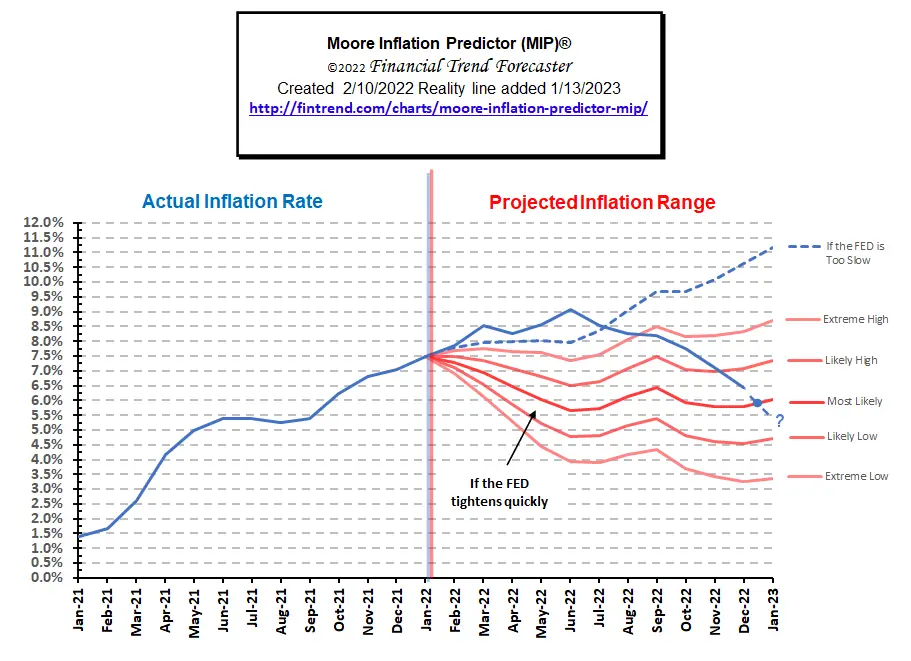 This month’s MIP shows some very interesting possibilities for the next six months. Believe it or not… Based on current projections, if all goes well, annual inflation could theoretically fall below 3% by this June and even approach the FED’s 2% target by November. But that is a best-case scenario. The “most likely” scenario is around 4% by November.
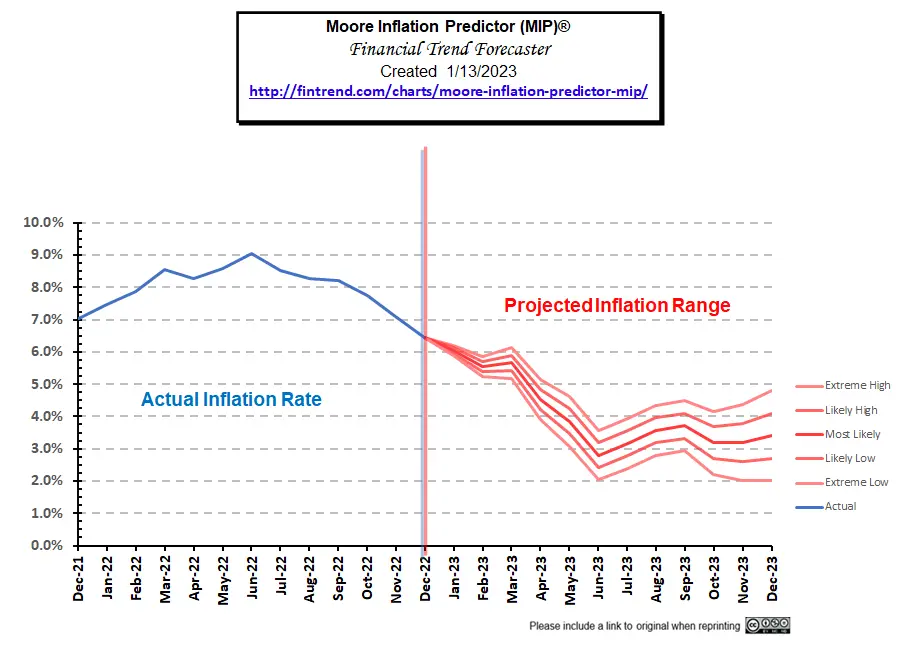
See this month’s full MIP Chart and commentary here.
NYSE ROC – Moves from Sell to Hold
There are also some VERY interesting developments in the NYSE. So interesting that we have switched from a Sell recommendation to a Hold recommendation.
For more info, See NYSE ROC and NASDAQ ROC for more.
Misery Index
Unemployment and Inflation were down.
[Read More on the Misery Index…]
Inflation-adjusted Oil Price Chart and Oil Price Table
We’ve also updated the Inflation adjusted Oil Price Chart and Oil Price Table
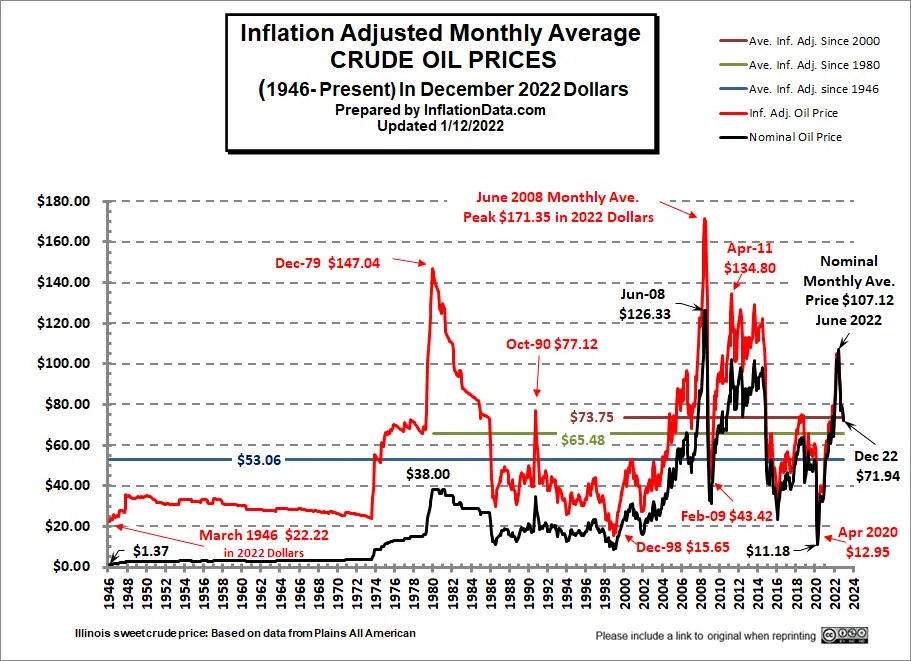
Read the full commentary here: Inflation-adjusted Crude Oil Chart and here Inflation-Adjusted Oil Prices in Table Form
You Might Also Like:
From InflationData.com
- November Producer Price Index Declines from 2021 to 2022
- Gasoline Prices vs. Wages Over Time
- Can Businesses Really Set Any Price They Want?
- November FED Announcement Rocks Stock Market
- What is the Reverse Wealth Effect and Why Does the FED Want It?
From Financial Trend Forecaster
- NYSE ROC Chart
- NASDAQ ROC Chart
- Are Countries Getting Smaller?
- Is the U.S. Dollar Hegemony Ending?
- Latest Recession Alarm
- Housing Is Getting Less Affordable
- Are Housing Prices Set to Crash?
- Half-Way to the Stock Market’s Worst Case Scenario
- Don’t Fight the FED
- Will Loan Forgiveness Raise College Costs?
- How Long Will This Recession Last?
- Is The U.S. A Powerful “Empire” In Decline?
From UnemploymentData.com.
- December 2022 Employment Report
- 5 Career Opportunities for Disabled Individuals
- 4 Careers that Don’t Require a 4 Year Degree
- November Jobs Report
- Are You Eligible for Social Security Disability Benefits?
From Elliott Wave University
- 60% stocks, 40% bonds? Ha!
- U.S. Dollar: Has the Mainstream Been Way Too Confident?
- Banks Are Becoming More Cautious About Lending
- Are You Prepared for Widespread Bank Failures?
- Will Another “Great Depression” Start in Europe?
- Stocks Don’t Go Straight Up (or Straight Down)
From OptioMoney
- Simple Ways to Save Money When Shopping Online
- How to Start Saving for Your Education
- 6 Tips for Moving Out of Your Parent’s Home with No Money
- 5 Tips for Paying Off Your Debt
- Warning Signs You’re On the Road to Financial Catastrophe
From Your Family Finances
- Quick Health Insurance Tips
- Simple Ways to Avoid Overspending This Holiday Season
- 5 Ways to Sell Your Real Estate in a Tight Market
- Questions to Ask When Hiring a Wealth Management Service
- 7 Tips for Comparing Moving Estimates

Leave a Reply