

Inflation Takes a Bite Out of Your Food Budget
The Bureau of Labor Statistics reported that in May 2022, Annual Inflation Rose.
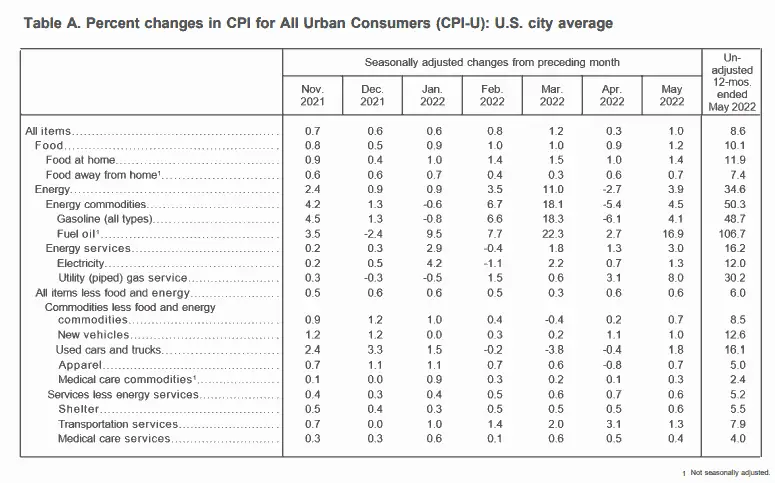
May Food Inflation Breaks Record:
The combined food index (at home and away) increased 10.1 percent for the 12-months ending May, the first annual increase of 10 percent or more since the period ending March 1981.
Food at home rose even more… 11.9% over the last 12 months… while food away from home “only” rose 7.4% over the last year.
All six major grocery store food group indexes rose in May. The index for dairy and related products rose 2.9 percent, its largest monthly increase since July 2007. The index for nonalcoholic beverages increased 1.7 percent, and the index for other food at home rose 1.6 percent.
The cereals and bakery products index increased 1.5 percent, the index for meats, poultry, fish, and eggs rose 1.1 percent over the month, with the index for eggs rising 5.0 percent. And the index for fruits and vegetables rose 0.6 percent in May.
BLS April 2022 Inflation Report:
According to the BLS commissioner’s report, ‘”The Consumer Price Index for All Urban Consumers (CPI-U) increased 1.0 percent in May on a seasonally adjusted basis after rising 0.3 percent in April, the U.S. Bureau of Labor Statistics reported today. Over the last 12 months, the all items index increased 8.6 percent before seasonal adjustment. The increase was broad-based, with the indexes for shelter, gasoline, and food being the largest contributors. After declining in April, the energy index rose 3.9 percent over the month with the gasoline index rising 4.1 percent and the other major component indexes also increasing. The food index rose 1.2 percent in May as the food at home index increased 1.4 percent…
Inflation Summary:
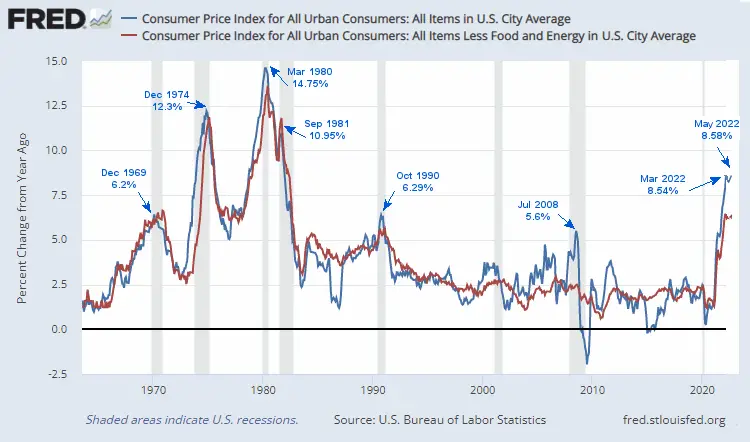
- Annual Inflation rose to 8.58% above March’s 8.54%
- CPI Index rose from 289.109 to 292.296.
- Monthly Inflation for May was 1.10%
- Next release July 13th
Annual inflation for the 12 months ending in May was 8.58% up from 8.26% in April.
| January 2021 | January 2022 | February 2022 | March 2022 | April 2022 | May 2022 |
| 1.40% | 7.48% | 7.87% | 8.54% | 8.26% | 8.58% |
…The all items index increased 8.6 percent for the 12 months ending May, the largest 12-month increase since the period ending December 1981. The all items less food and energy index rose 6.0 percent over the last 12 months. The energy index rose 34.6 percent over the last year, the largest 12-month increase since the period ending September 2005.”
Inflation All Items vs. Core Inflation Chart
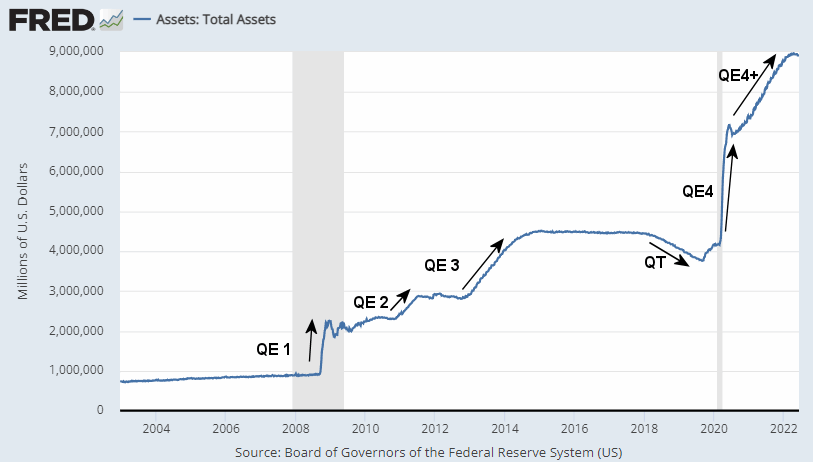
At its March meeting, the Fed signaled that it would be reducing its massive bond holdings at a maximum pace of $95 billion a month to cool inflation. This was set to begin in May. But FED Assets peaked at $8.965 Trillion on April 13th and have reduced slightly since then to 8.918 Trillion as of June 8th.
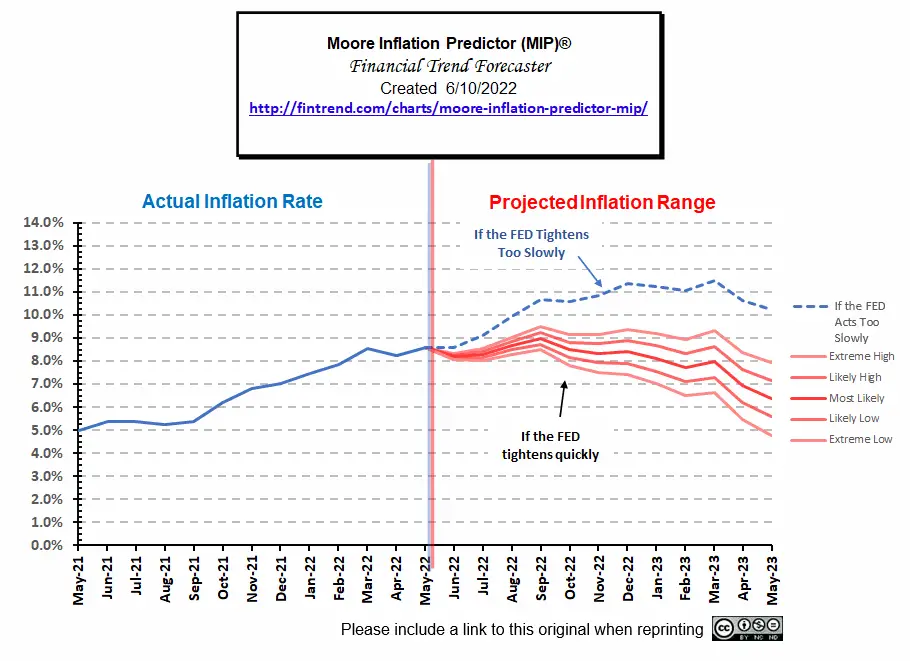
Moore Inflation Predictor
If the FED continues to reduce assets despite the carnage it will create in the stock market, inflation rates could come down. But it could take longer than most people expect. Looking closely at the chart you see that a year from now the best we can hope for is 5% inflation and 8% isn’t out of the realm of possibility. If the FED chickens out 11% is still possible.
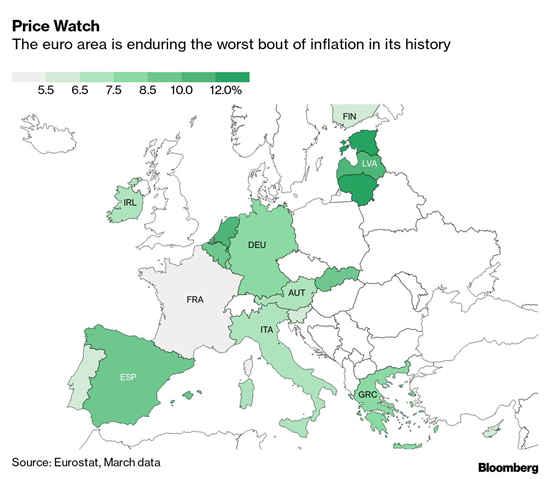
 It isn’t just our Central Bank that has been printing money for too long European Central Banks have followed our lead and are now in the same situation as we are.
According to John Authers of Bloomberg: “inflation in the euro zone has come as much more of a surprise than in the rest of the world… The extent of the surprise has been driven by the severity of the inflation. In Europe, its natural gas crisis over the winter, followed by the war in Ukraine, created a huge rise in prices. German producer price inflation is now 33.5%, comfortably the highest since the current series started.”
Monthly Inflation
At 0.84% (January), 0.91% (February), and 1.34% (March), monthly inflation was high even for the first quarter of the year when monthly inflation is already at its highest. April is the first month this year to come in lower than 2021. But May came in higher again.
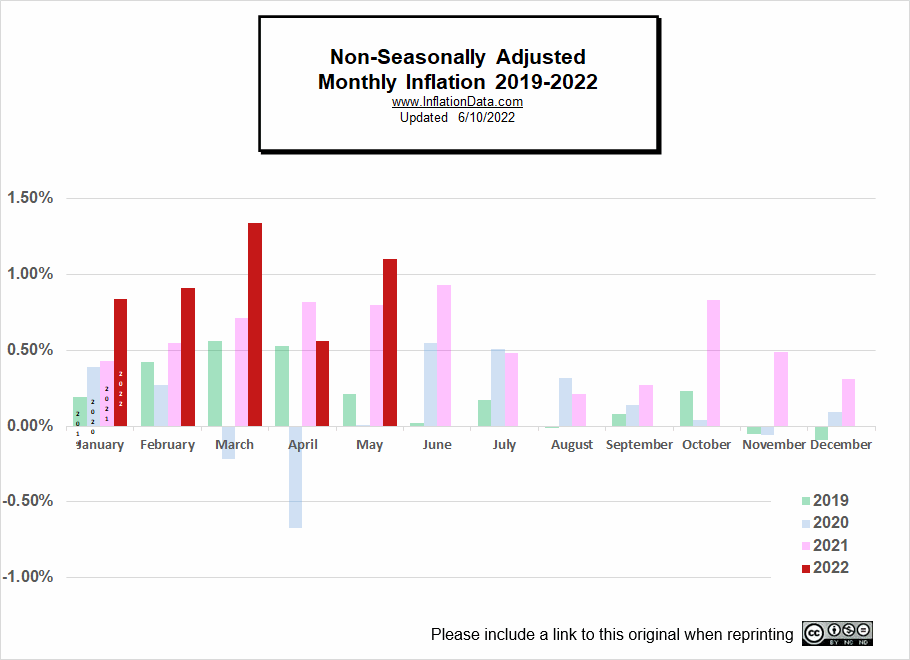
Not Seasonally Adjusted Monthly Inflation Rates
Note: January 2022’s 0.84% was the highest January since 1990.
| Jan | Feb | Mar | Apr | May | Jun | Jul | Aug | Sep | Oct | Nov | Dec | |
| 2016 | 0.17% | 0.08% | 0.43% | 0.47% | 0.41% | 0.33% | (0.16%) | 0.09% | 0.24% | 0.12% | (0.16%) | 0.03% |
| 2017 | 0.58% | 0.31% | 0.08% | 0.30% | 0.09% | 0.09% | (0.07%) | 0.30% | 0.53% | (0.06%) | 0.002% | (0.06%) |
| 2018 | 0.54% | 0.45% | 0.23% | 0.40% | 0.42% | 0.16% | 0.01% | 0.06% | 0.12% | 0.18% | (0.33%) | (0.32%) |
| 2019 | 0.19% | 0.42% | 0.56% | 0.53% | 0.21% | 0.02% | 0.17% | (0.01%) | 0.08% | 0.23% | (0.05%) | (0.09%) |
| 2020 | 0.39% | 0.27% | (0.22%) | (0.67%) | 0.002% | 0.55% | 0.51% | 0.32% | 0.14% | 0.04% | (0.06%) | 0.09% |
| 2021 | 0.43% | 0.55% | 0.71% | 0.82% | 0.80% | 0.93% | 0.48% | 0.21% | 0.27% | 0.83% | 0.49% | 0.31% |
| 2022 | 0.84% | 0.91% | 1.34% | 0.56% | 1.10% |
See: Monthly Inflation Rate for more information and a complete table of Unadjusted Monthly Rates.
Inflation-Adjusted Oil Prices
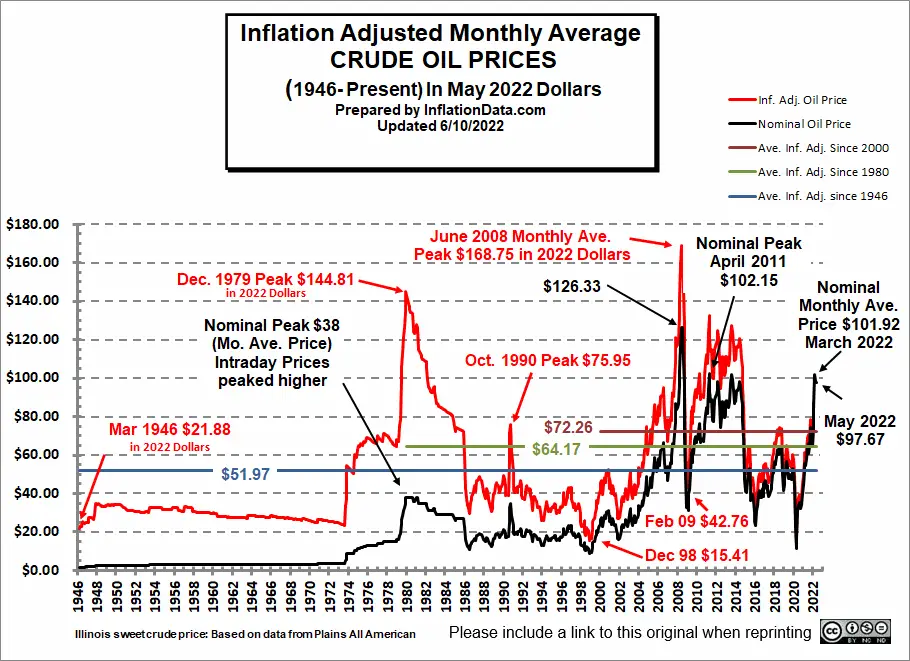
See: Inflation-Adjusted Oil Price Chart and Historical Oil Price Table for more info.
Inflation Adjusted Gasoline Prices
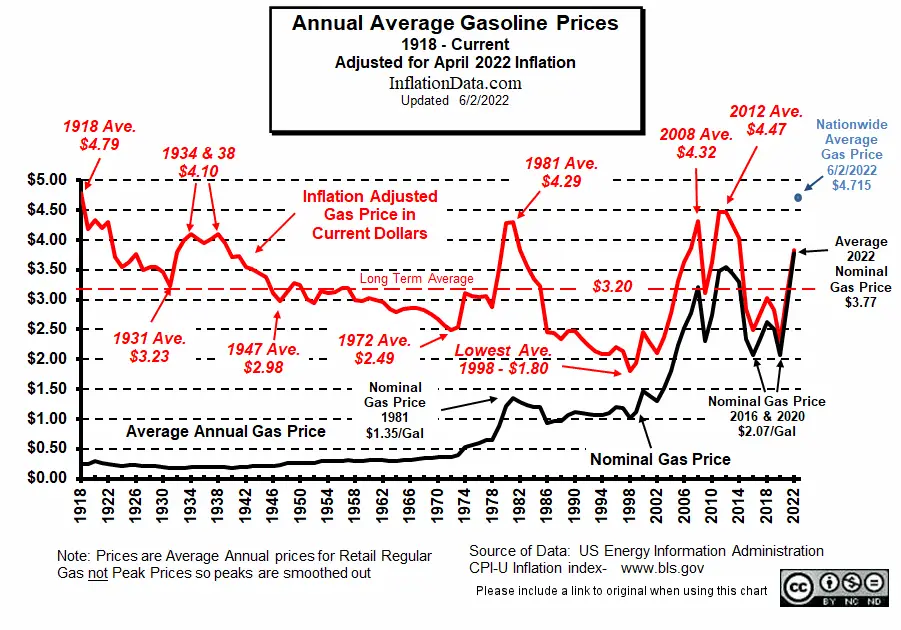
See Inflation -Adjusted Gasoline Prices and Inflation-Adjusted Gasoline Hits New High
FED Funds Rate
In April 2022, the FED raised interest rates to 0.33% and in May they raised them to 0.77%. This may look like a big increase but in 2019 rates were 2.42% and inflation was nowhere near current levels.
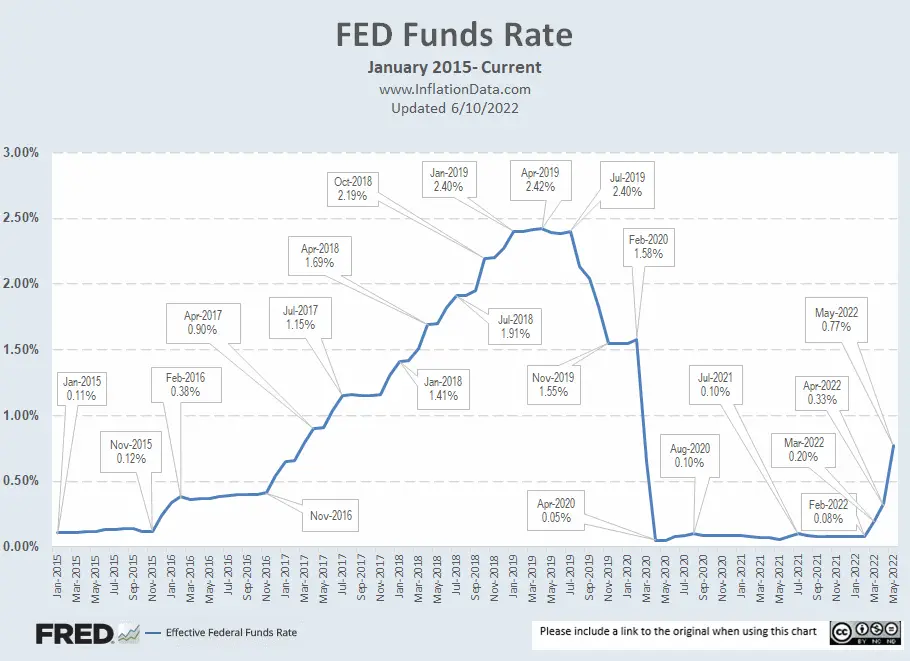
Looking back we can see that current rates are barely a blip on the chart.
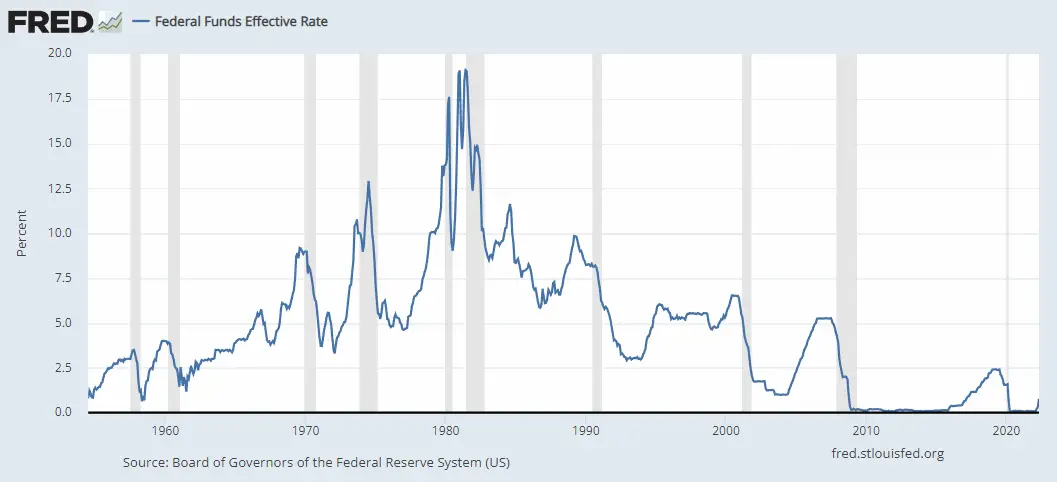
Chart Data Source St Louis FED.
For more info, See NYSE ROC and MIP.
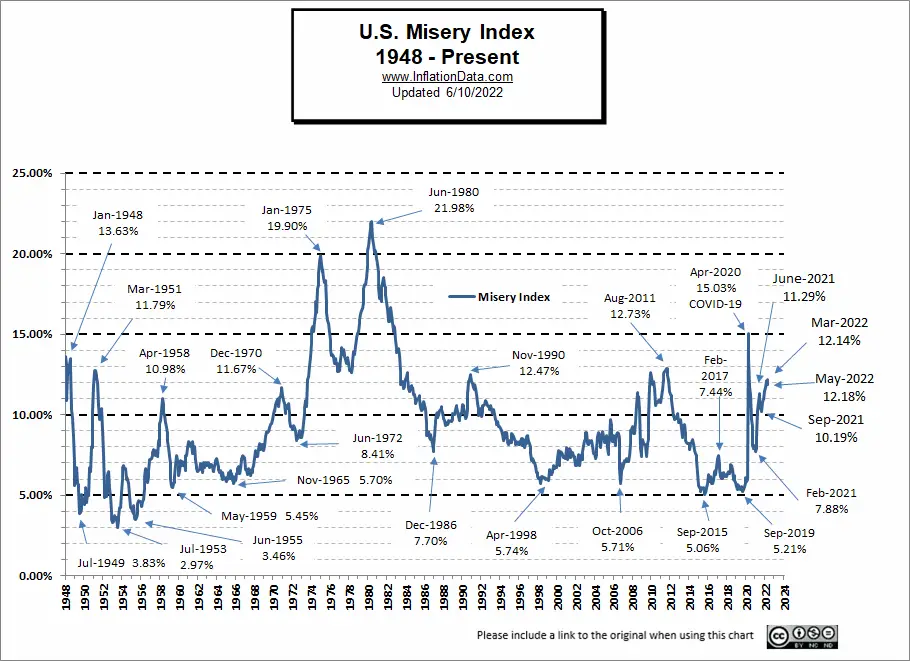
Misery Index
Unemployment was unchanged in April, and Inflation was down slightly, so the Misery index decreased.
| Unemployment | Inflation | Misery Index | |
| January 2022 | 4.0% | 7.48% | 11.48% |
| February 2022 | 3.8% | 7.87% | 11.67% |
| March 2022 | 3.6% | 8.54% | 12.14% |
| April 2022 | 3.6% | 8.26% | 11.86% |
| May 2022 | 3.6% | 8.58% | 12.18% |
[Read More…]
NYSE Rate of Change (ROC)©

Sell Signal
The NYSE ROC index is WAY below its moving average.
See the NYSE ROC for more info.
NASDAQ Rate of Change (ROC)©

Sell Signal
The NASDAQ ROC is well below its moving average.
See NASDAQ ROC for more.
You Might Also Like:
From InflationData.com
- Inflation Adjusted Gasoline Hits New High (almost )
- Worldwide Inflation by Country 2022
- Analyzing 5 Ways You Can Hedge Against Surging Inflation
- April Inflation Down, But…
- Roots of Our Current Inflation
- How Families Are Adjusting To The Crazy Inflation Rates
- How To Invest In Cryptocurrency: 4 Tips For Beginners To Get Started
- March Inflation Highest Since 1981
From UnemploymentData.com.
- May Employment Up – Unemployment Unchanged
- How Is Time Management Important In The Workplace?
- Top Cities for Gig Worker Opportunities
- April Unemployment Holds Steady
- Jobs of the Future: Growing Your Career in the IT Field
From Financial Trend Forecaster
- NYSE ROC Chart
- NASDAQ ROC Chart
- The Fed’s New “Tightening” Plan Is Too Little, Too Late
- The Fed’s New “Tightening” Plan Is Too Little, Too Late
- Keynesians and Market Monetarists Didn’t See Inflation Coming
- Elon Musk Ambushes Twitter
- Can Ruthless Governments Make Crypto Worthless?
- Will Russian Sanctions Open a Can of Worms?
- In What Universe is $100+ Crude Oil Cheap?
- Economic Warfare Deployed Against Russia
- The Surprising Implications Of Declining Global Birth Rates
- Technology And The Semiconductor Chip Shortage
From Elliott Wave University
- What to Make of the Stock Market’s Bounce
- Is the Correction Over Yet?
- Why Investors are Consistently Fooled by the Stock Market
- Is Bitcoin Headed to Zero?
- Predicting the Collapse of a “Parabolic Rise”
From OptioMoney.com
- Common Tax Mistakes That You Need To Avoid
- 6 Passive Income Ideas to Grow Your Wealth
- Surprising Ways a Storage Unit Can Save You Money
- Guide to Managing Small Business Finances
- Unlock The Benefits Of A Good Credit Score
From Your Family Finances
- Yearly Home Checkup: What To Look For
- Investing in Cryptocurrency ?
- 5 Valuable Tips To Avoid A Whopping Moving Bill
- How Car Accidents Destroy Your Insurance Rates
- How To Recover Financially When You Have A Bankruptcy

Thanks! Good stuff.