
The Bureau of Labor Statistics reported that the Annual Inflation Rate rose again in November.
Inflation Summary:
- Annual Inflation highest since May 1982.
- CPI Index rose from 276.589 to 277.948.
- Monthly Inflation for November was 0.49%
- Next release January 12, 2022
Inflation for the 12 months ending in November was Up again from October.
October 6.22% — November 6.81%
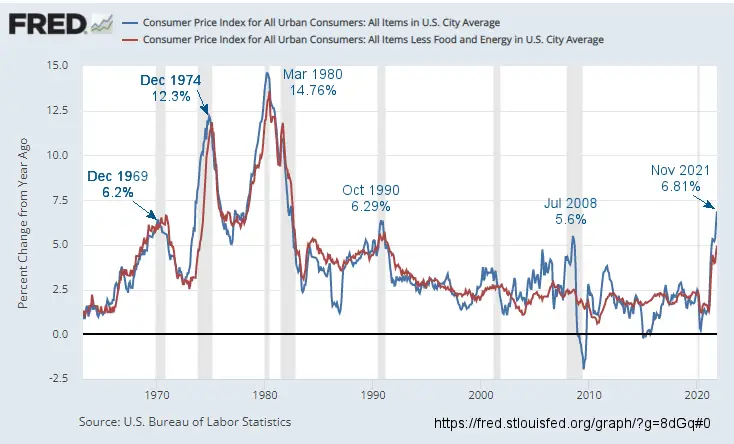
The earliest millennials were born somewhere between 1980-1985 (depending on which definition of millennial you use), just as we were coming off one of the highest Inflation spikes the U.S. has seen since they began tracking the CPI in 1913. In March of 1980, Inflation topped at 14.76%. By May of 1982, it had fallen to 6.9%, which was the last time inflation was higher than today’s 6.81%. Of course, there’s a big difference between the peak in 1980 and current levels, but as we discuss below, there is still the possibility that Inflation will climb higher from here.
Click for Larger Image
BLS Commissioner’s Inflation Report:
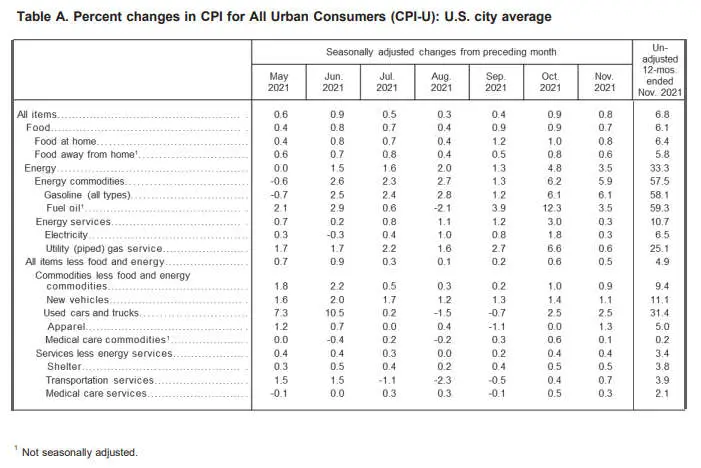
According to the BLS commissioner’s report, “The Consumer Price Index for All Urban Consumers (CPI-U) increased 0.8 percent in November on a seasonally adjusted basis after rising 0.9 percent in October, the U.S. Bureau of Labor Statistics reported today. Over the last 12 months, the all items index increased 6.8 percent before seasonal adjustment.
The monthly all items seasonally adjusted increase was the result of broad increases in most component indexes, similar to last month. The indexes for gasoline, shelter, food, used cars and trucks, and new vehicles were among the larger contributors. The energy index rose 3.5 percent in November as the gasoline index increased 6.1 percent, and the other major energy component indexes also rose. The food index increased 0.7 percent as the index for food at home rose 0.8 percent. “
Seasonally Adjusted Inflation Components Table
Click for Larger Image
But since we calculate it to two decimal places, this month’s Annual Inflation was 6.81%, and monthly Inflation on a NON-Adjusted basis was 0.49%. Note that monthly Inflation increased 0.8% on an Adjusted basis, but on a non-adjusted basis, it was “only” up 0.49%. That means that monthly Inflation in November was almost twice as high as is typical for November. As we have stated many times, October through December are usually VERY LOW inflation months, often negative, i.e., disinflationary, so at 0.49%, that is high for a November and more typical of January through May.
Key components of November’s increase were Gasoline prices which increased 58.1% over the last year, up 6.1% over the previous month. Used Cars and Trucks were also up 31.4% over year-ago prices. Food was up 6.1% over year-ago prices.
See: From Pandemic To 2021 Supply Chain Disruption for more information. We’ve also updated the Inflation Adjusted Corn prices chart.
November 2021 Inflation Situation
The Current Annual inflation Rate for the 12 months ending in November was 6.81% above October’s 6.22% and significantly above September’s 5.39%. This followed the run-up from December 2020’s 1.36%. So Inflation is currently 5X last December’s rate.
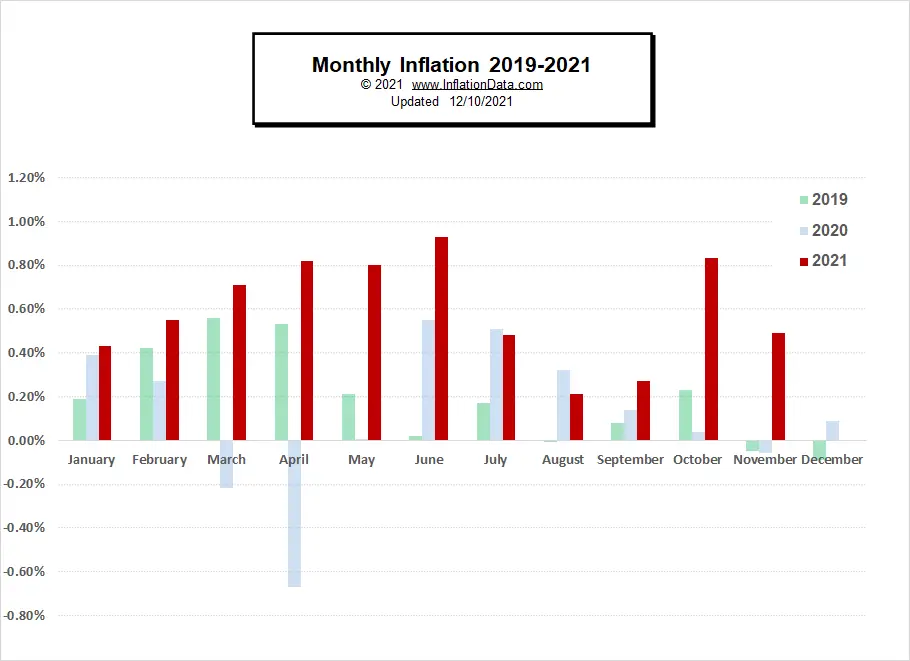
Monthly Inflation:
November’s monthly Inflation was 0.49%, compared to -0.06% in November 2020. Typically, October – December have extremely low (or even negative) monthly Inflation, so having a massive number like this indicates a shift toward much higher annual Inflation.
Click for Larger Image
See Annual Inflation for more information.
Moore Inflation Predictor
We changed the projection model in March due to the FED’s pronouncements. FED chairman Jerome Powell insisted that Inflation would not be a problem, i.e., that the spike was only “transitory”. So we added an additional line to project what was possible if the FED’s pronouncement was wrong. And even that number was slightly low for last month’s projection.
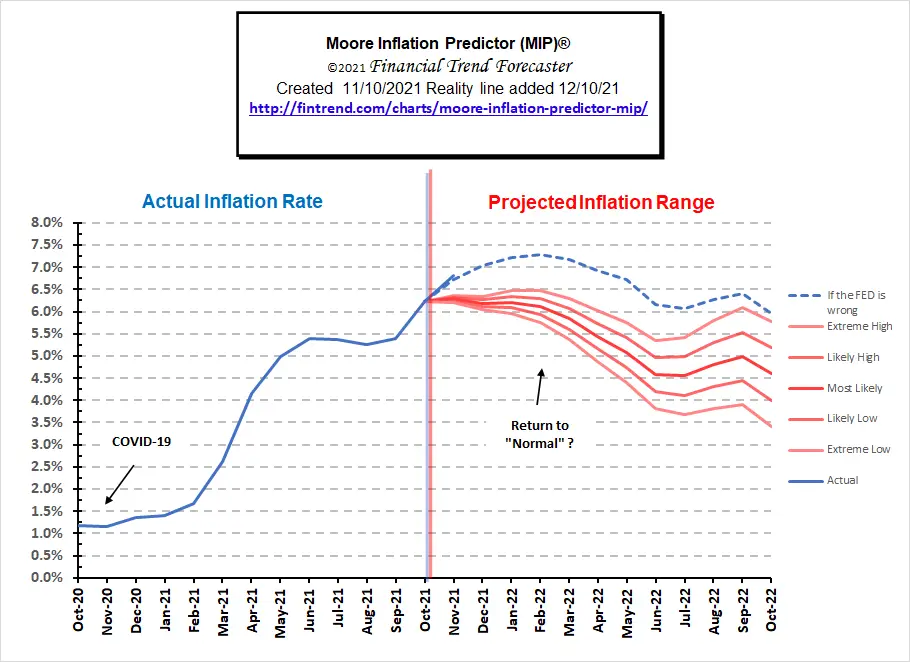 See our Moore Inflation Predictor for this month’s projection.
Not Seasonally Adjusted Monthly Inflation Rates
As we can see from the table below, the monthly numbers for the 4th quarter of 2020 are very low. If 2021 numbers come in above those numbers, the annual inflation rate will rise.
| Jan | Feb | Mar | Apr | May | Jun | Jul | Aug | Sep | Oct | Nov | Dec | |
| 2016 | 0.17% | 0.08% | 0.43% | 0.47% | 0.41% | 0.33% | (0.16%) | 0.09% | 0.24% | 0.12% | (0.16%) | 0.03% |
| 2017 | 0.58% | 0.31% | 0.08% | 0.30% | 0.09% | 0.09% | (0.07%) | 0.30% | 0.53% | (0.06%) | 0.002% | (0.06%) |
| 2018 | 0.54% | 0.45% | 0.23% | 0.40% | 0.42% | 0.16% | 0.01% | 0.06% | 0.12% | 0.18% | (0.33%) | (0.32%) |
| 2019 | 0.19% | 0.42% | 0.56% | 0.53% | 0.21% | 0.02% | 0.17% | (0.01%) | 0.08% | 0.23% | (0.05%) | (0.09%) |
| 2020 | 0.39% | 0.27% | (0.22%) | (0.67%) | 0.002% | 0.55% | 0.51% | 0.32% | 0.14% | 0.04% | (0.06%) | 0.09% |
| 2021 | 0.43% | 0.55% | 0.71% | 0.82% | 0.80% | 0.93% | 0.48% | 0.21 | 0.27 | 0.83% | 0.49% |
See: Monthly Inflation Rate for more information and a complete table of Unadjusted Monthly Rates.
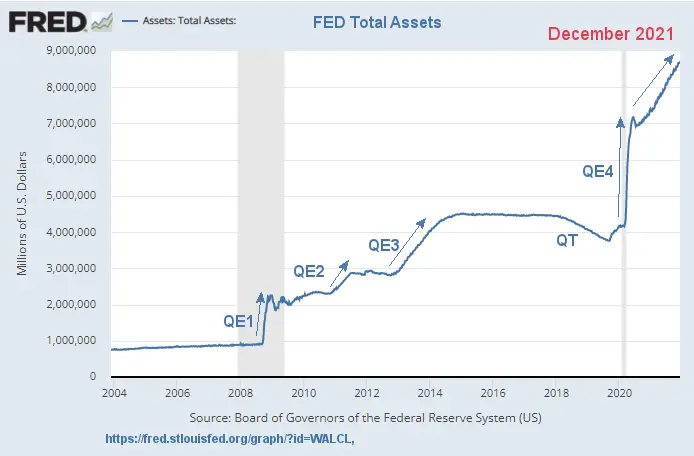
Federal Reserve Actions
Despite the increase in Inflation, the FED still isn’t tapering off its money printing. However, they have begun hinting that it is a possibility. But tapering doesn’t mean reducing assets, it only means printing slower. So it seems relatively inevitable that Inflation will continue. Looking at total assets, we can see the same stairstep pattern we’ve been seeing for the last year.
Click for Larger Image
FED Funds Rate
As a matter of fact, they actually lowered the FED funds rate, albeit a minuscule 1/100% to 0.08% in September, and it remained there through November.
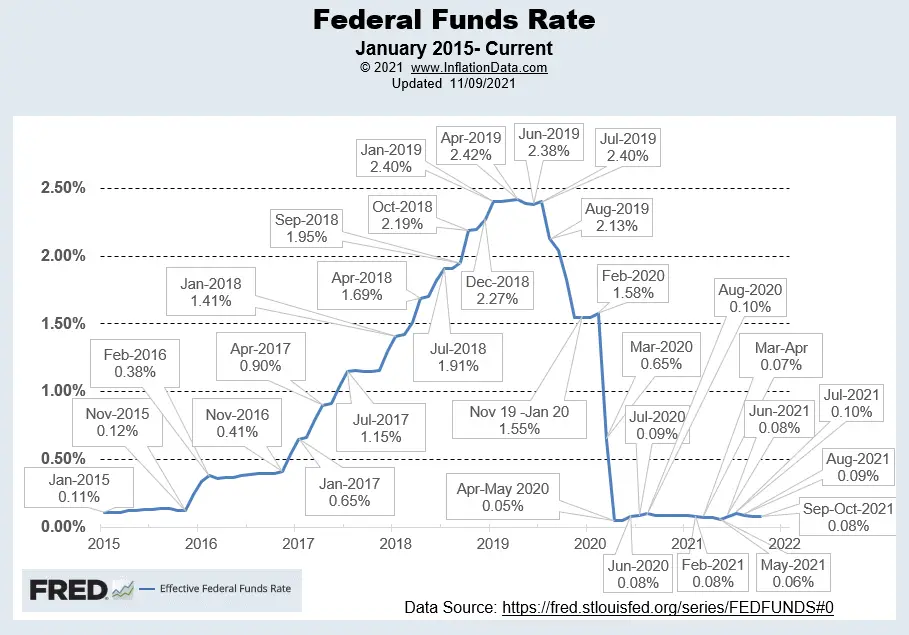 Chart Source St Louis FED.
For more info, See NYSE ROC and MIP.
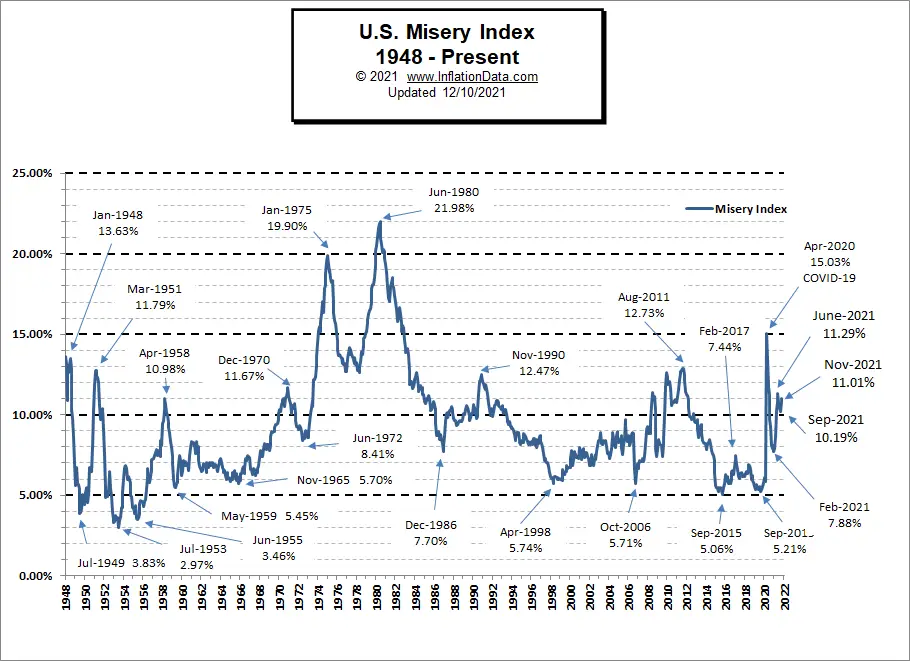
Misery Index
The misery index rose. Even though unemployment was down, Inflation was up more than unemployment was down.
Click for Larger Image
[Read More…]
NYSE Rate of Change (ROC)©

Sell Signal
The NYSE ROC index is down below its moving average.
See the NYSE ROC for more info.
NASDAQ Rate of Change (ROC)©

Sell Signal
The NASDAQ ROC, down well below its moving average.
See NASDAQ ROC for more.
You Might Also Like:
From InflationData.com
- Is Bitcoin a Better Inflation Hedge Than Gold?
- How Nixon’s Revolutionary Move Influenced U.S. Inflation For 50 Years
- U.S. Inflation is Not the Only One Increasing
- Inflation: The New Normal?
- How Businesses Cope With Inflation
- How Foreign Currencies Act as an Inflation Hedge
- How Insidious Inflation Affects the Affordability of Tuition and Fees
From UnemploymentData.com.
- November Jobs Up But…
- Starting a New Business? Tips to Find Capital to Begin
- Find Opportunities To Boost Your Military Career When You’re In A Slump
- High School Is Sufficient For These Mainstream Careers
From Financial Trend Forecaster
- NYSE ROC Chart
- NASDAQ ROC Chart
- Curing Cancer with T-Cells
- 5 Revolutionary Developments in the Financial Industry
- How Is Technology Affecting Global Trading Markets
- Why Wearable Brand Merchandise is On Trend
- From Pandemic To 2021 Supply Chain Disruption
- Batteries: New Sea-Water Based Battery to Replace Lithium
- Farming: Discovering New Ways to Feed the Planet
From Elliott Wave University
- Are Disease Outbreaks Market Indicators?
- Secrets To Maintain A Healthy Trading Psychology
- A Change May Be Nigh for Real Estate
- Will China’s Crackdown Send Bitcoin’s Price Tumbling?
- Why a Financial “Panic” May Be Just Around the Corner
From OptioMoney.com (New Look)
- Can You Make Money with a Home Music Studio?
- Quick Guide To The Secrets Of FHA Loans
- Creative Ways to Make Money In Retirement
- Covering the Cost of Cancer
- What to Consider When Shopping for Health Insurance
From Your Family Finances (New Look)
- Want a Sensational Side Hustle? Rent Vibrant Vacation Properties
- Top 5 Home Upgrades and Repairs Worth Your Money
- Clever Ways to Make Money with Your New House
- Services Your Family Can’t Live Without (or Can They?)
- How to Finance a New Home Before Selling Yours

Leave a Reply